EVgo’s 750-kW Charging Plan Comes With a More Complicated Growth Story
EVgo’s November 9 results pair a 750-kW charging plan with rising charging sales, softer total revenue and a network still being built.

A faster charger is an easy headline. A charging network that drivers can find, enter, pay for and use without rearranging their day is the harder product. EVgo’s November 9 earnings announcement puts those two stories next to each other: the company says its next-generation architecture will be capable of delivering up to 750 kilowatts, with deployments anticipated to begin in 2027, while its existing business is growing in ways that deserve a closer look than one peak-power number.
For the quarter ended September 30, EVgo reported $71.788 million in charging-network revenue, up 29% from a year earlier. Energy delivered through the network rose 8% to 103 gigawatt-hours. Total revenue, however, fell about 1% to $91.417 million. That combination is not a contradiction. EVgo sells charging services, develops infrastructure with partners and earns other revenue; those activities did not move together. The useful question for an American EV owner is which parts of the expansion translate into an additional working stop on a real route.
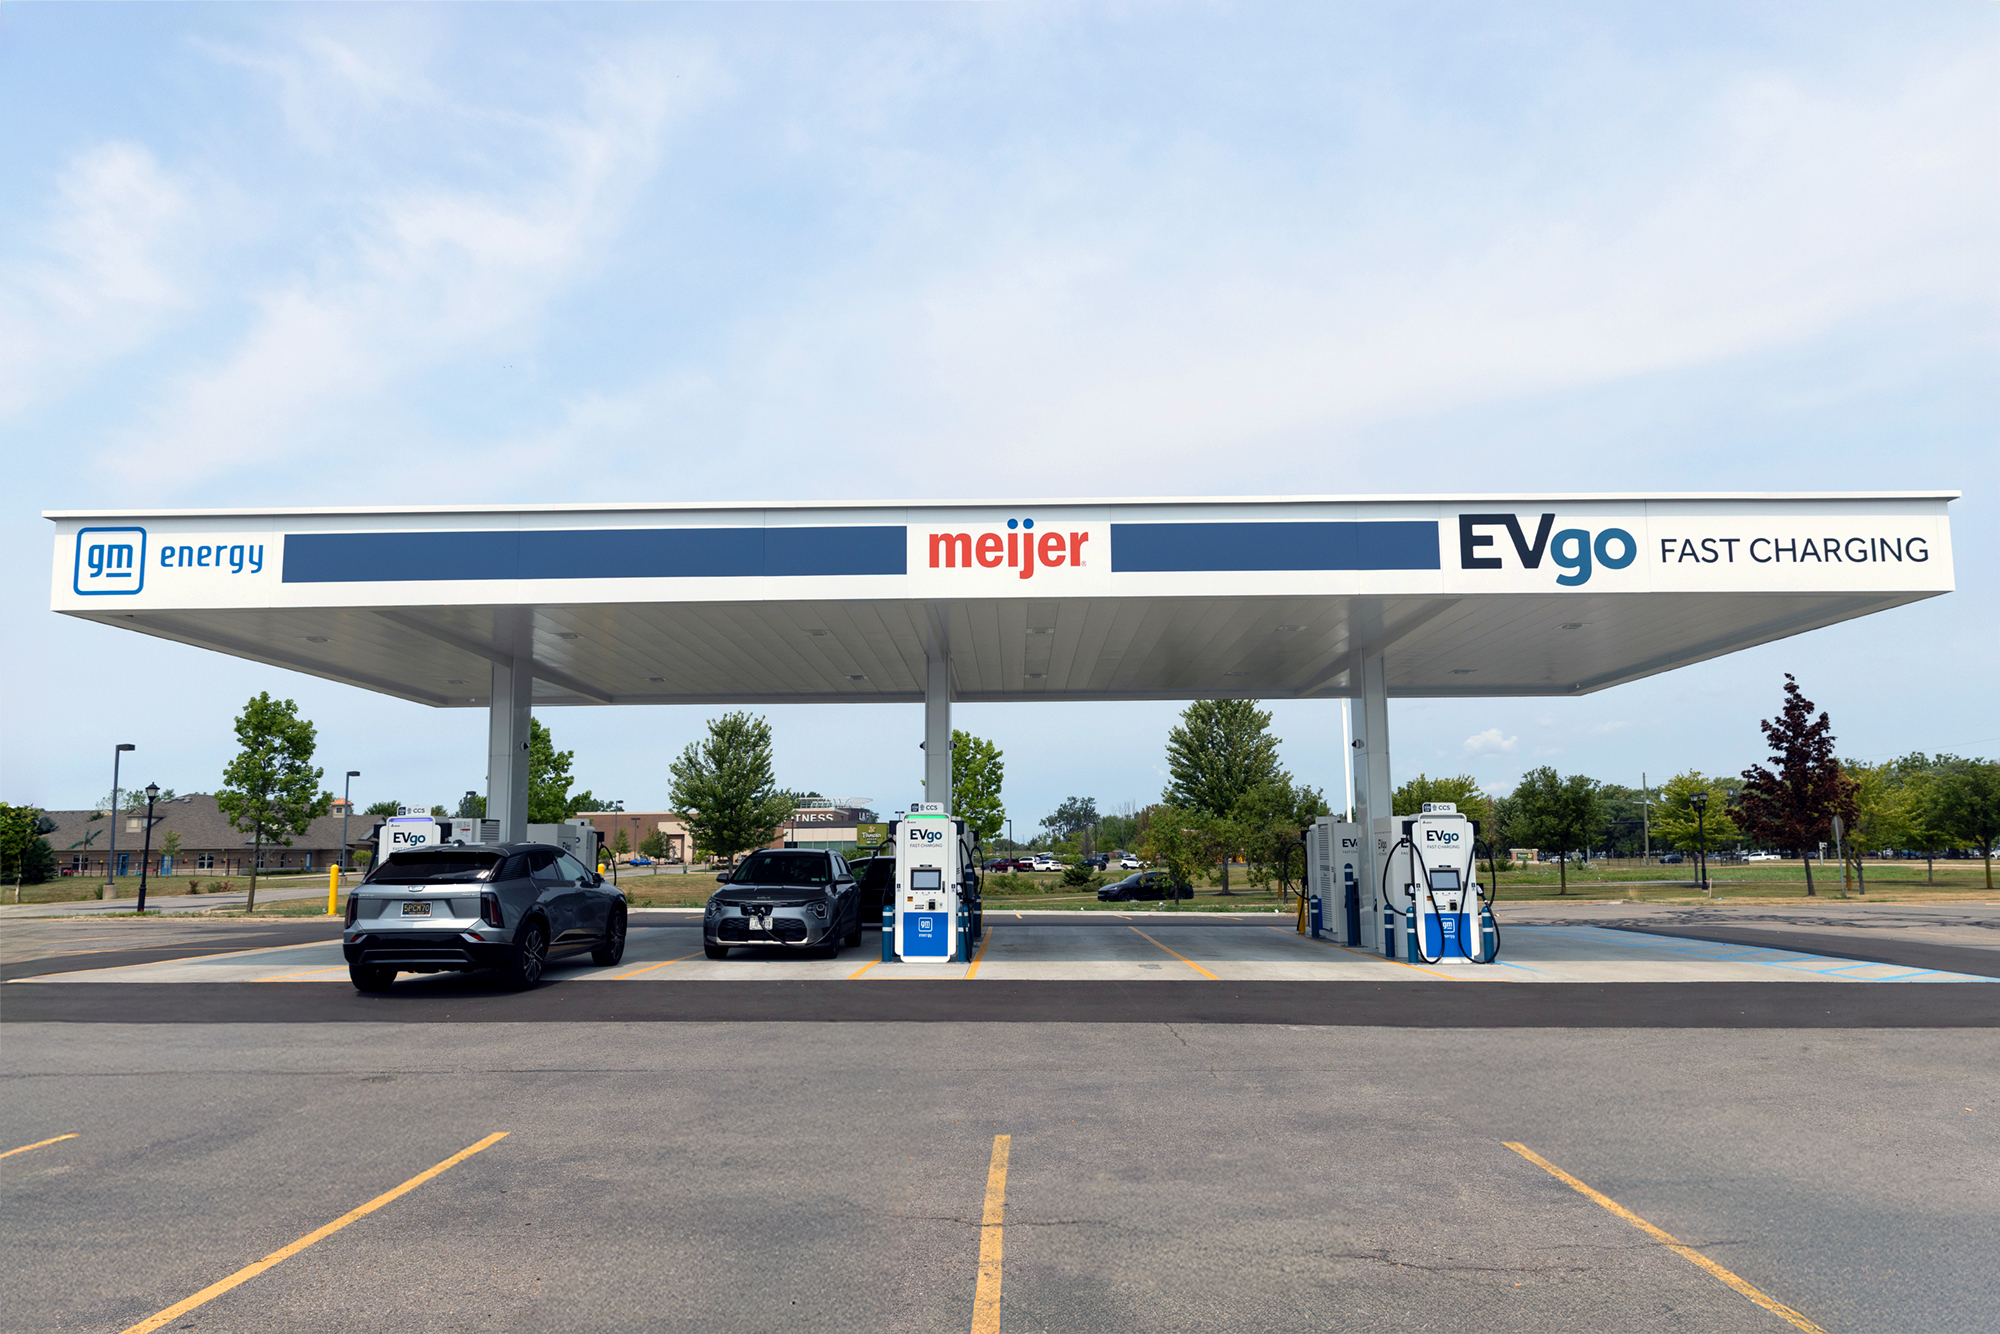
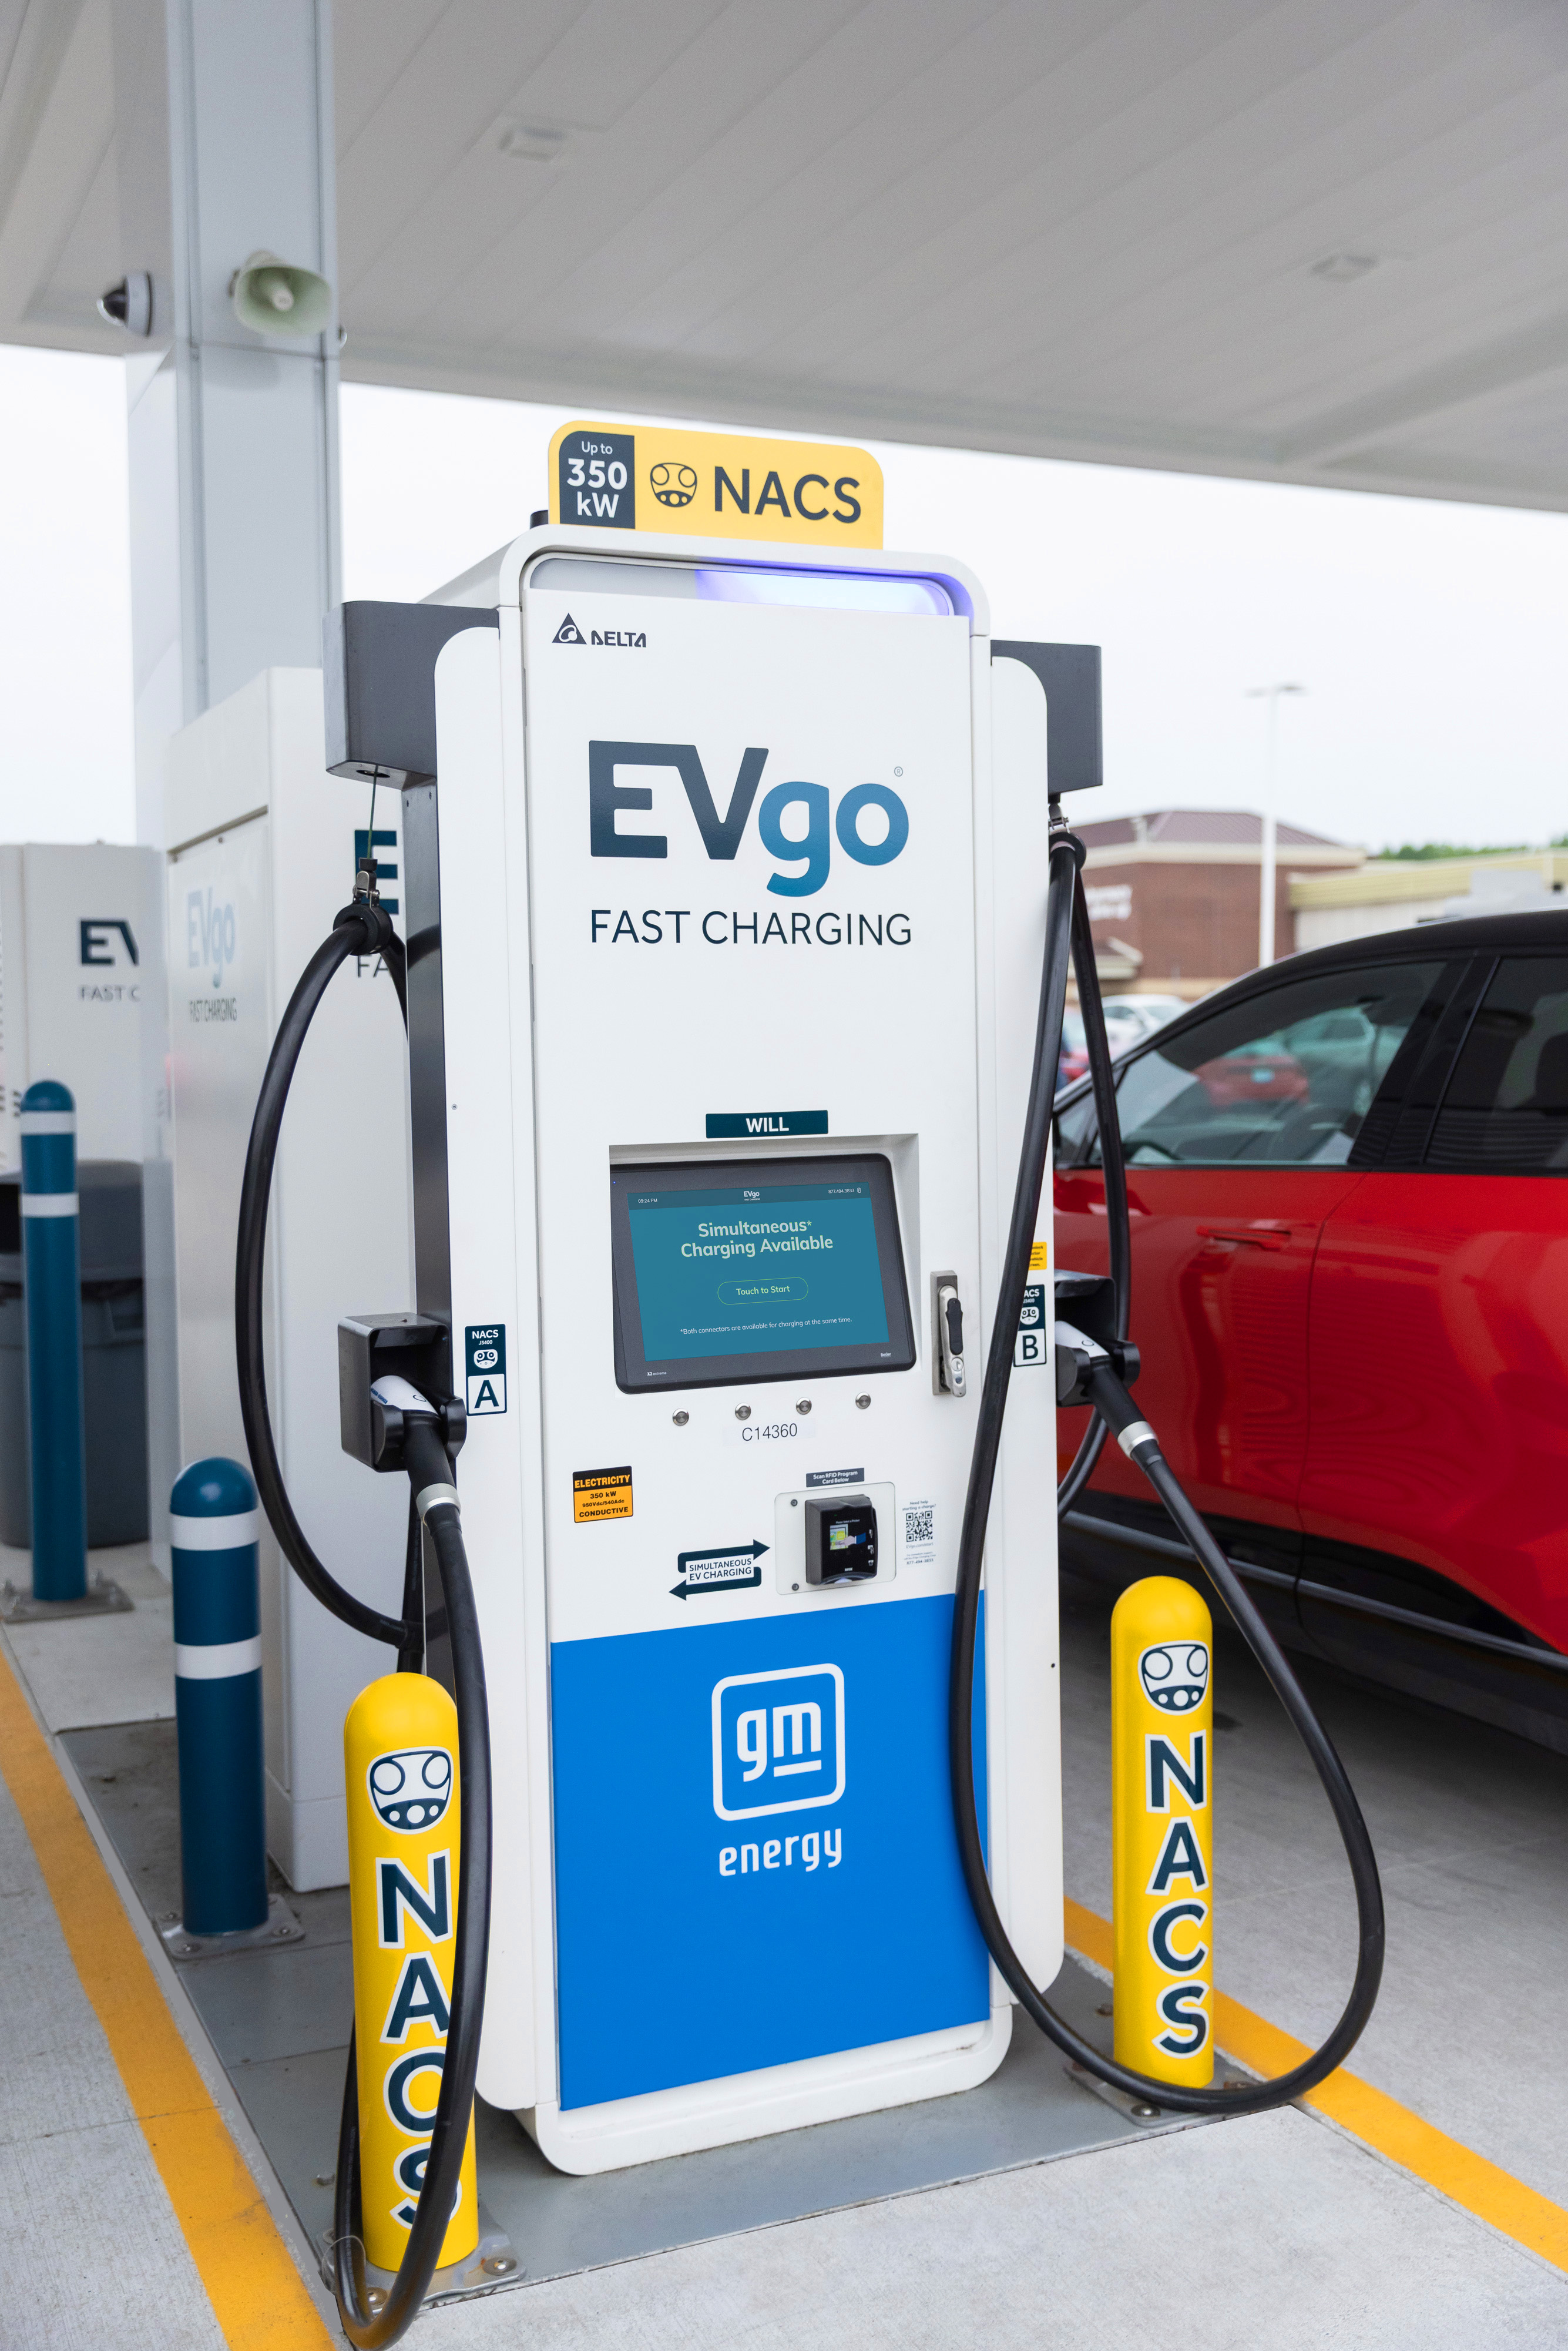
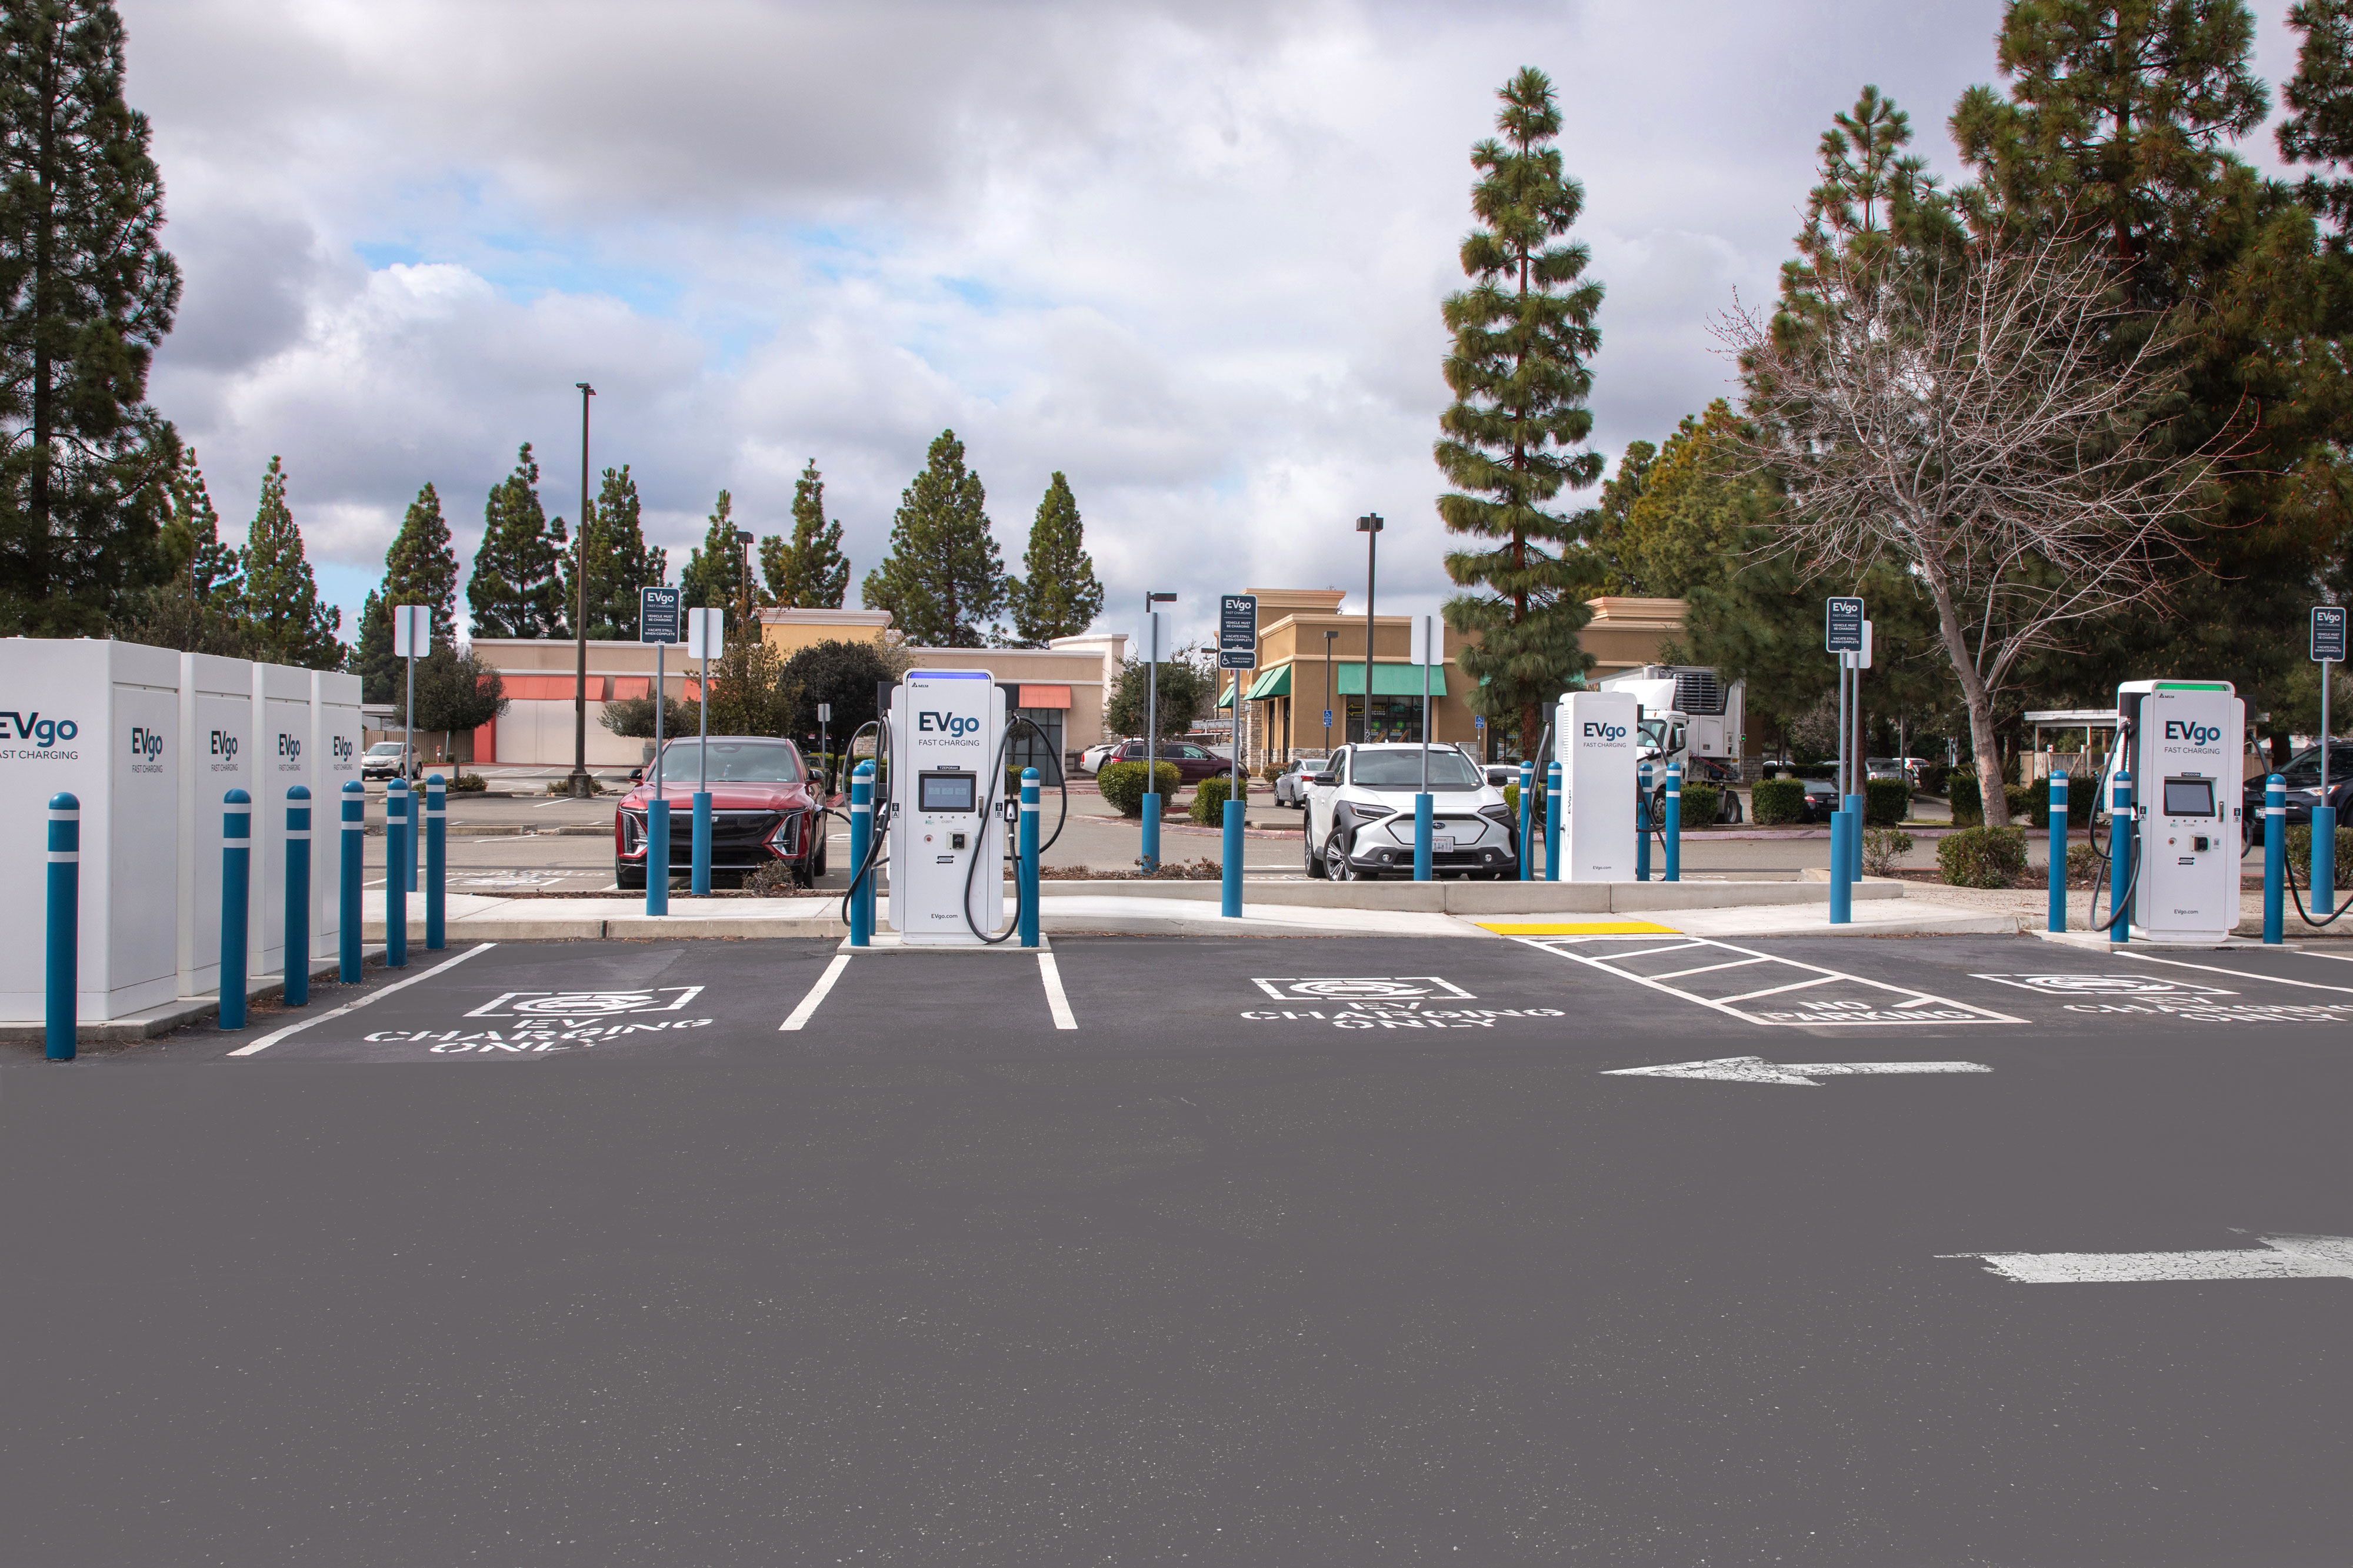
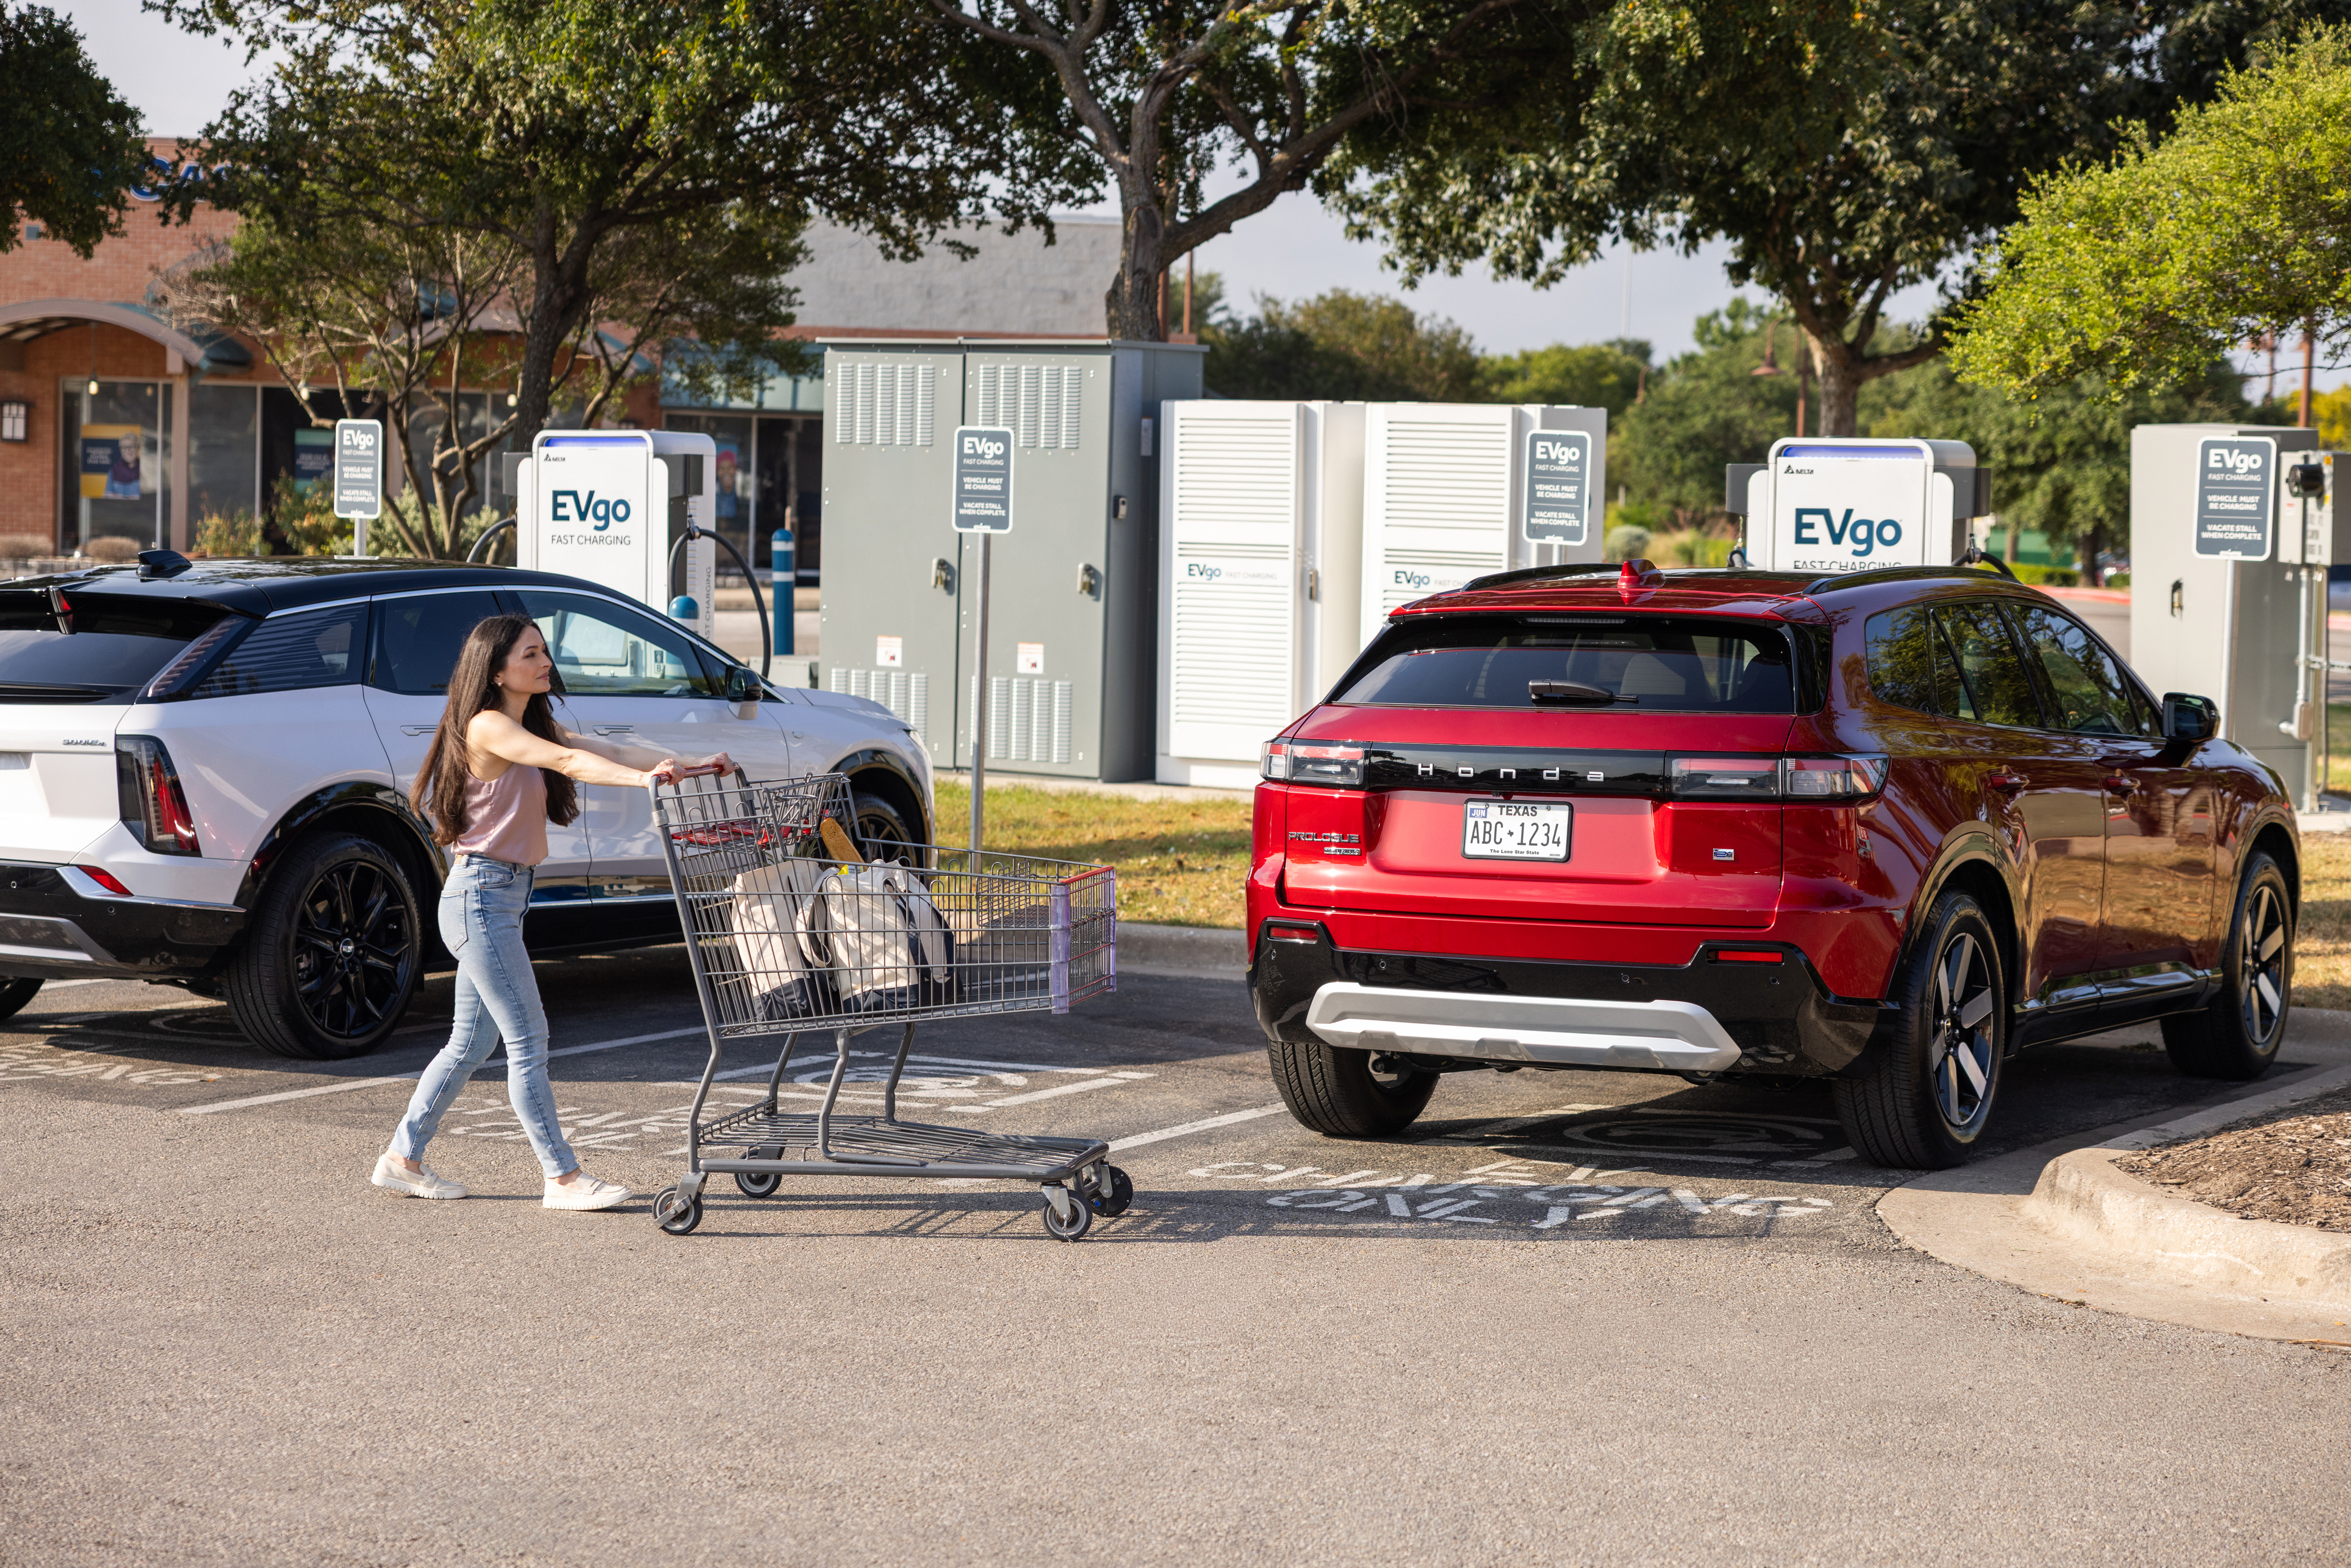
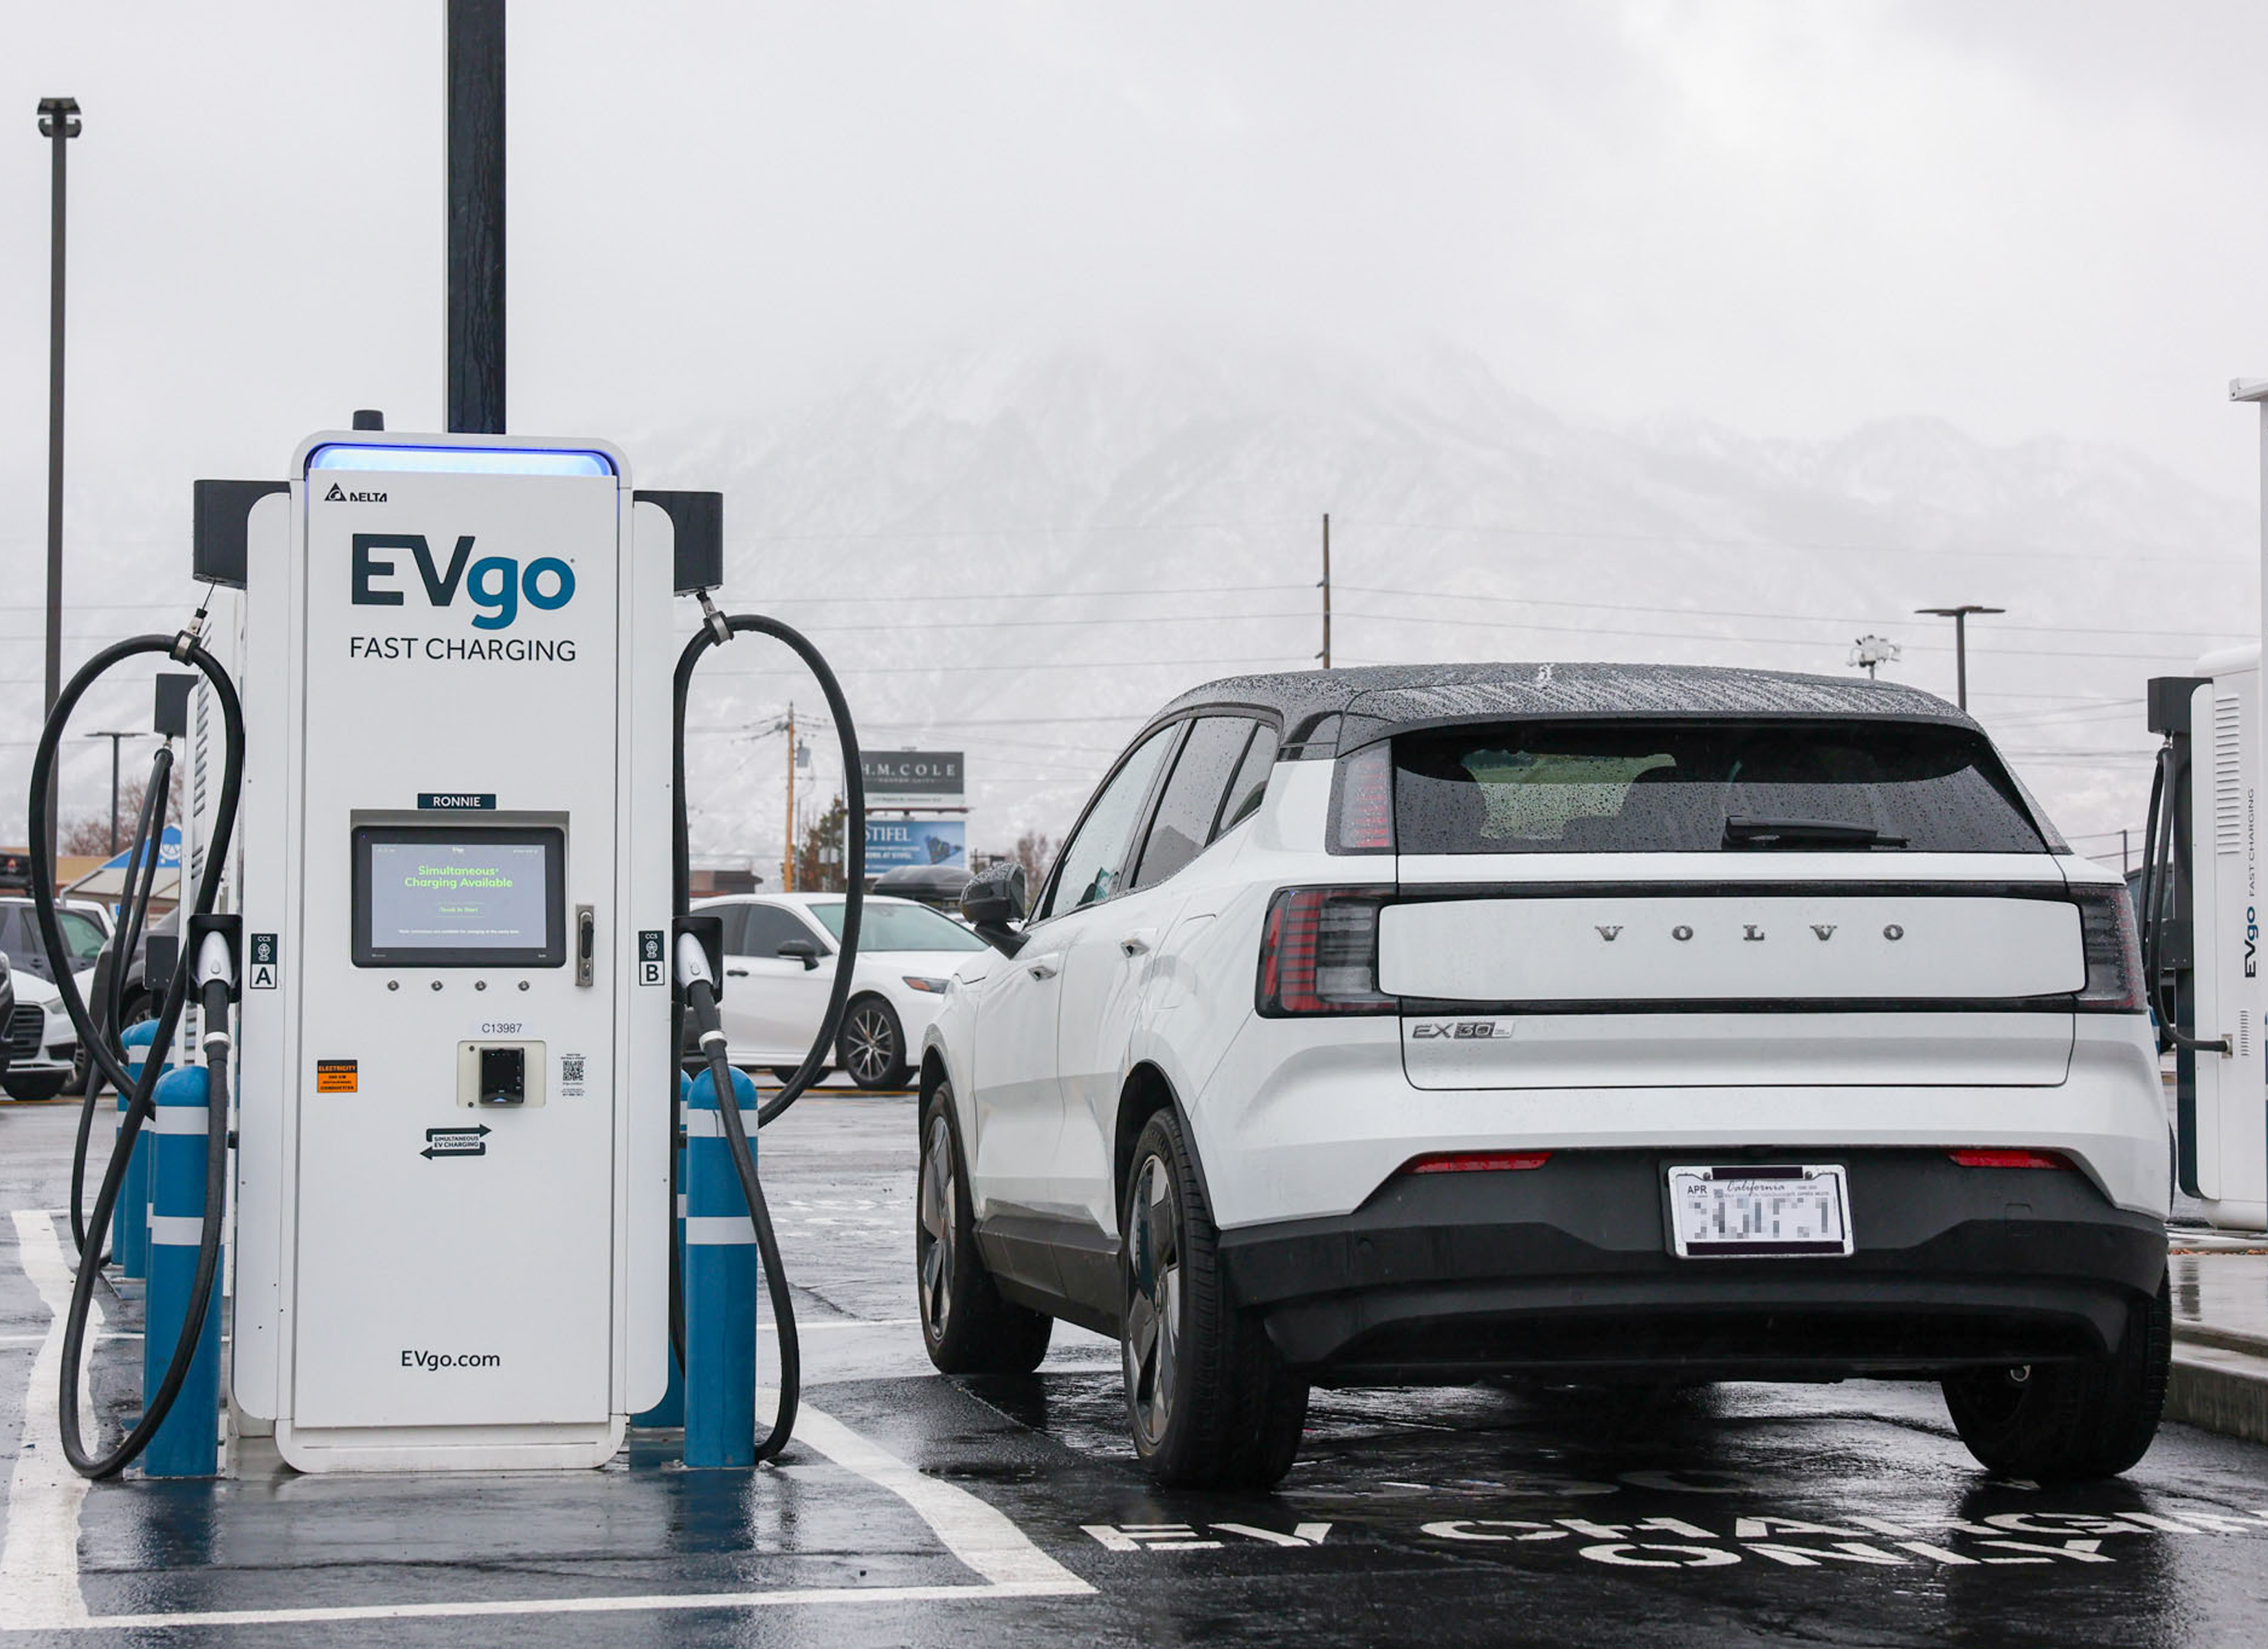
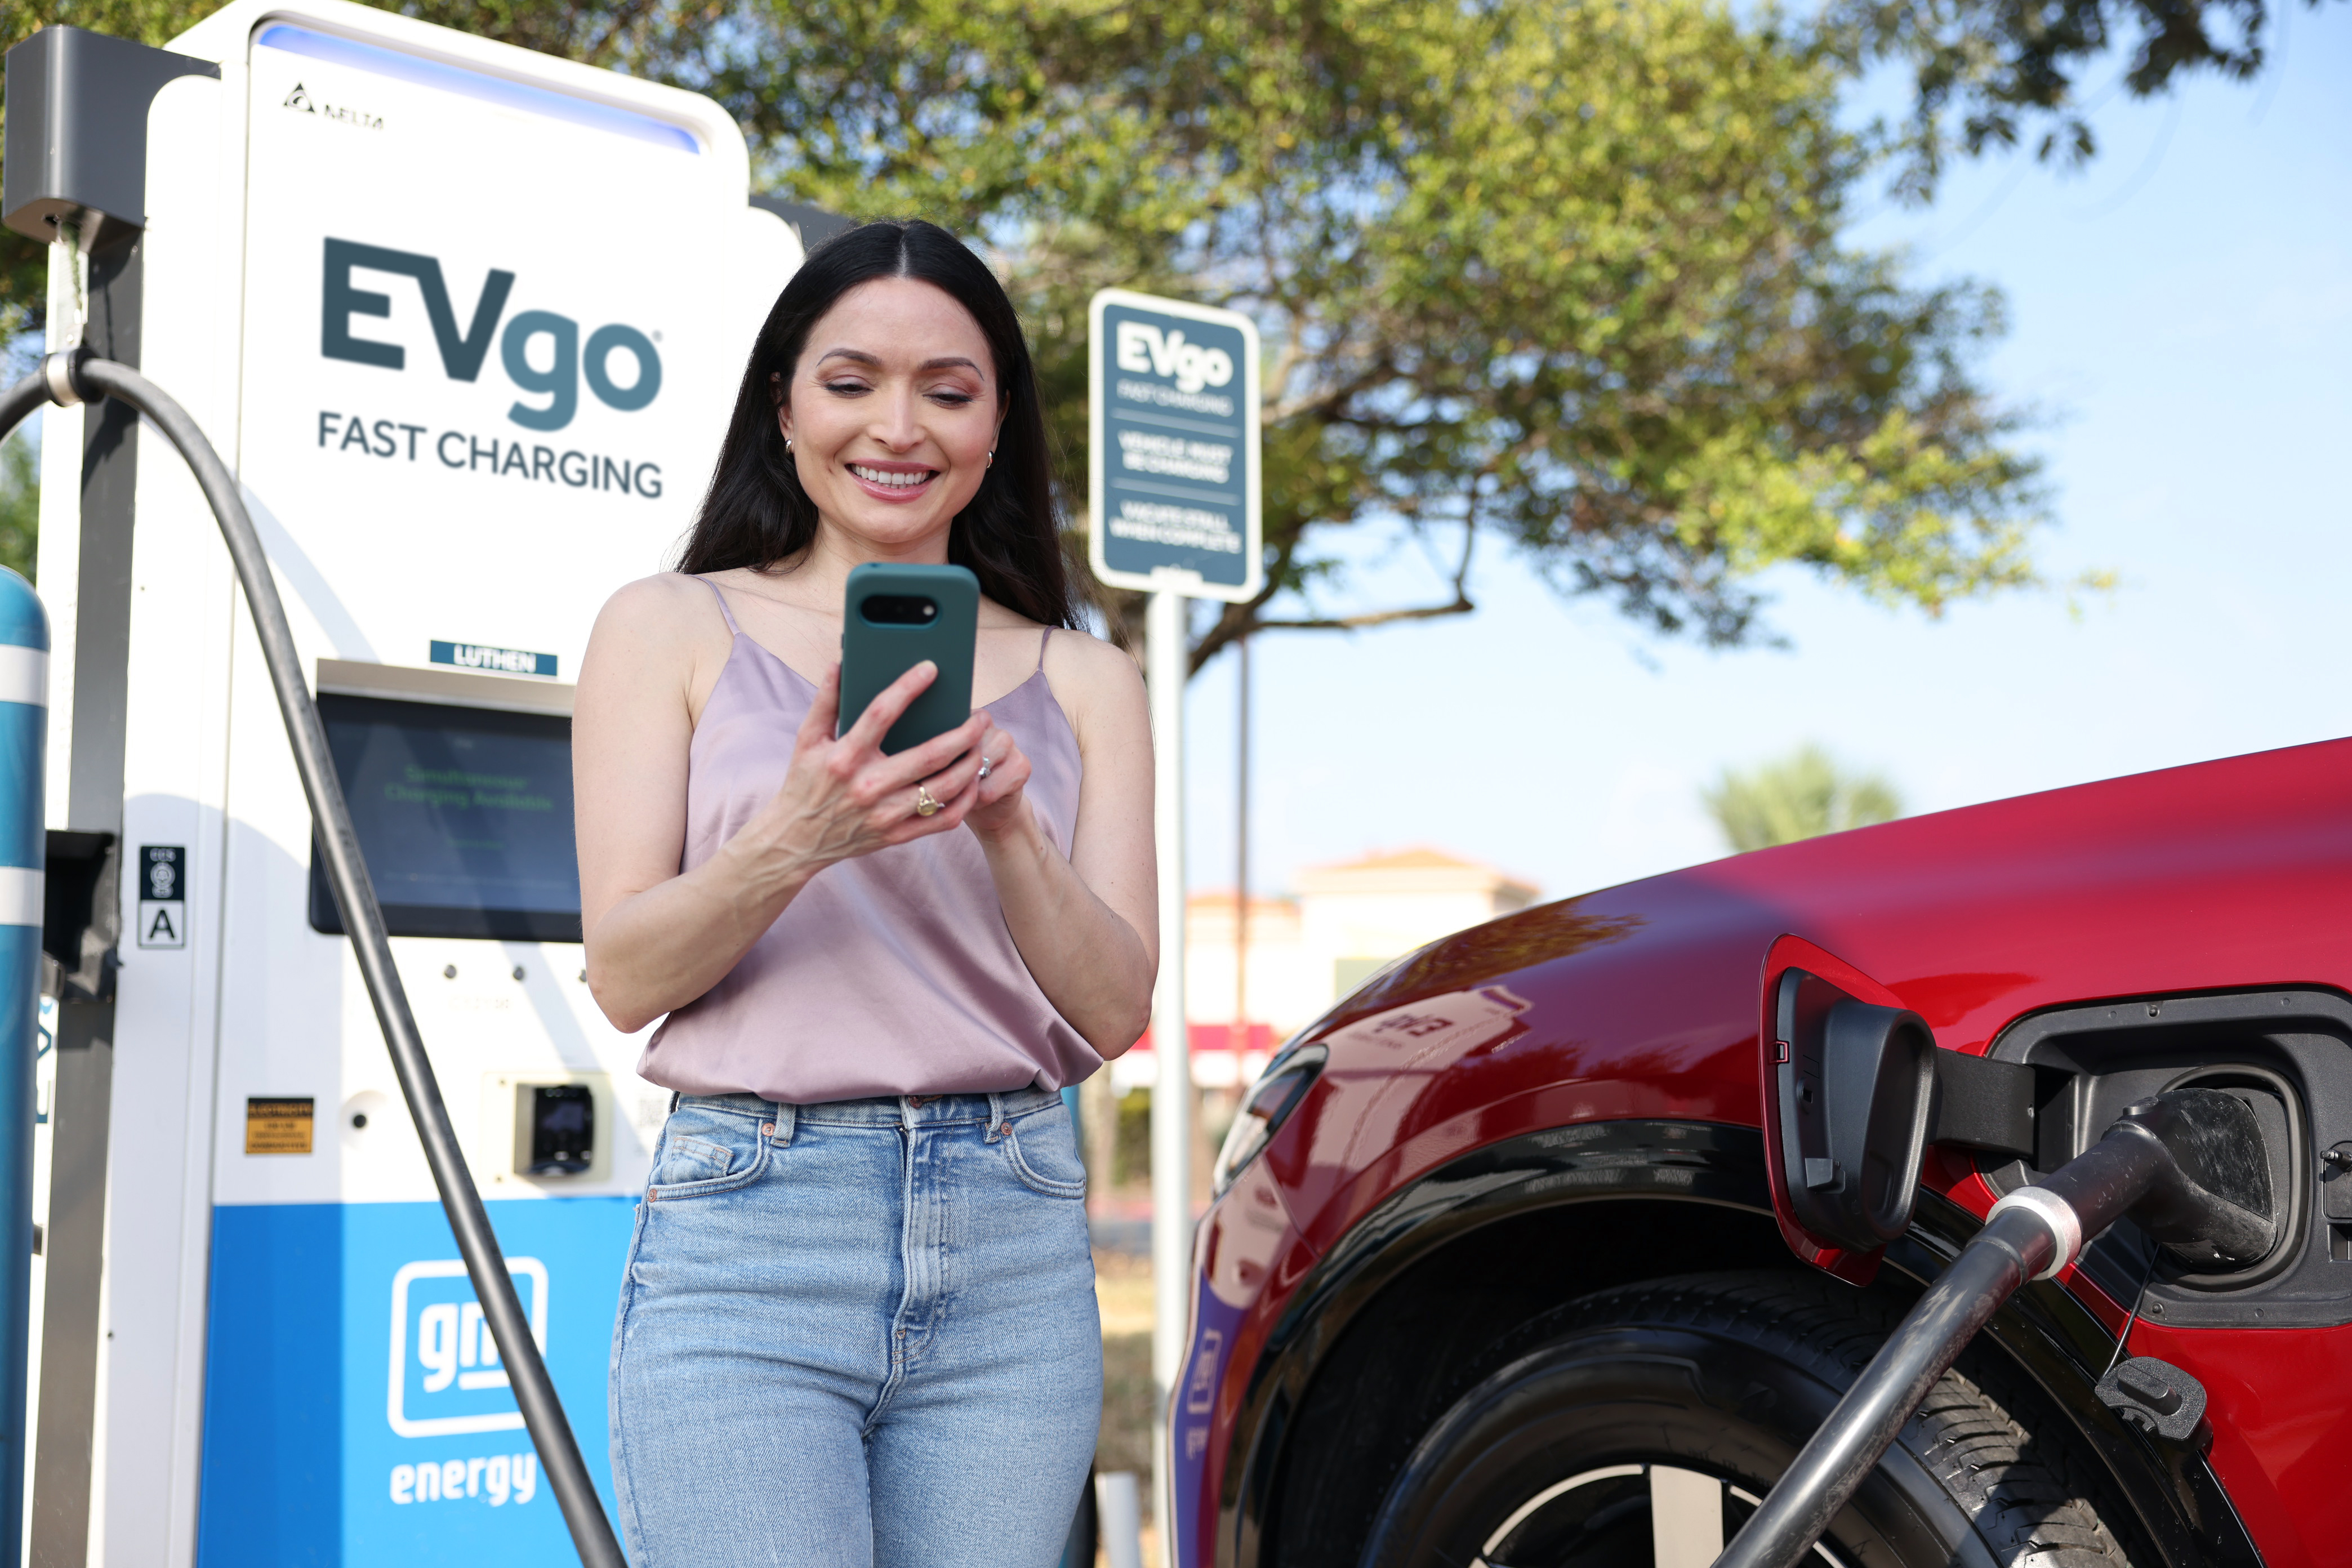
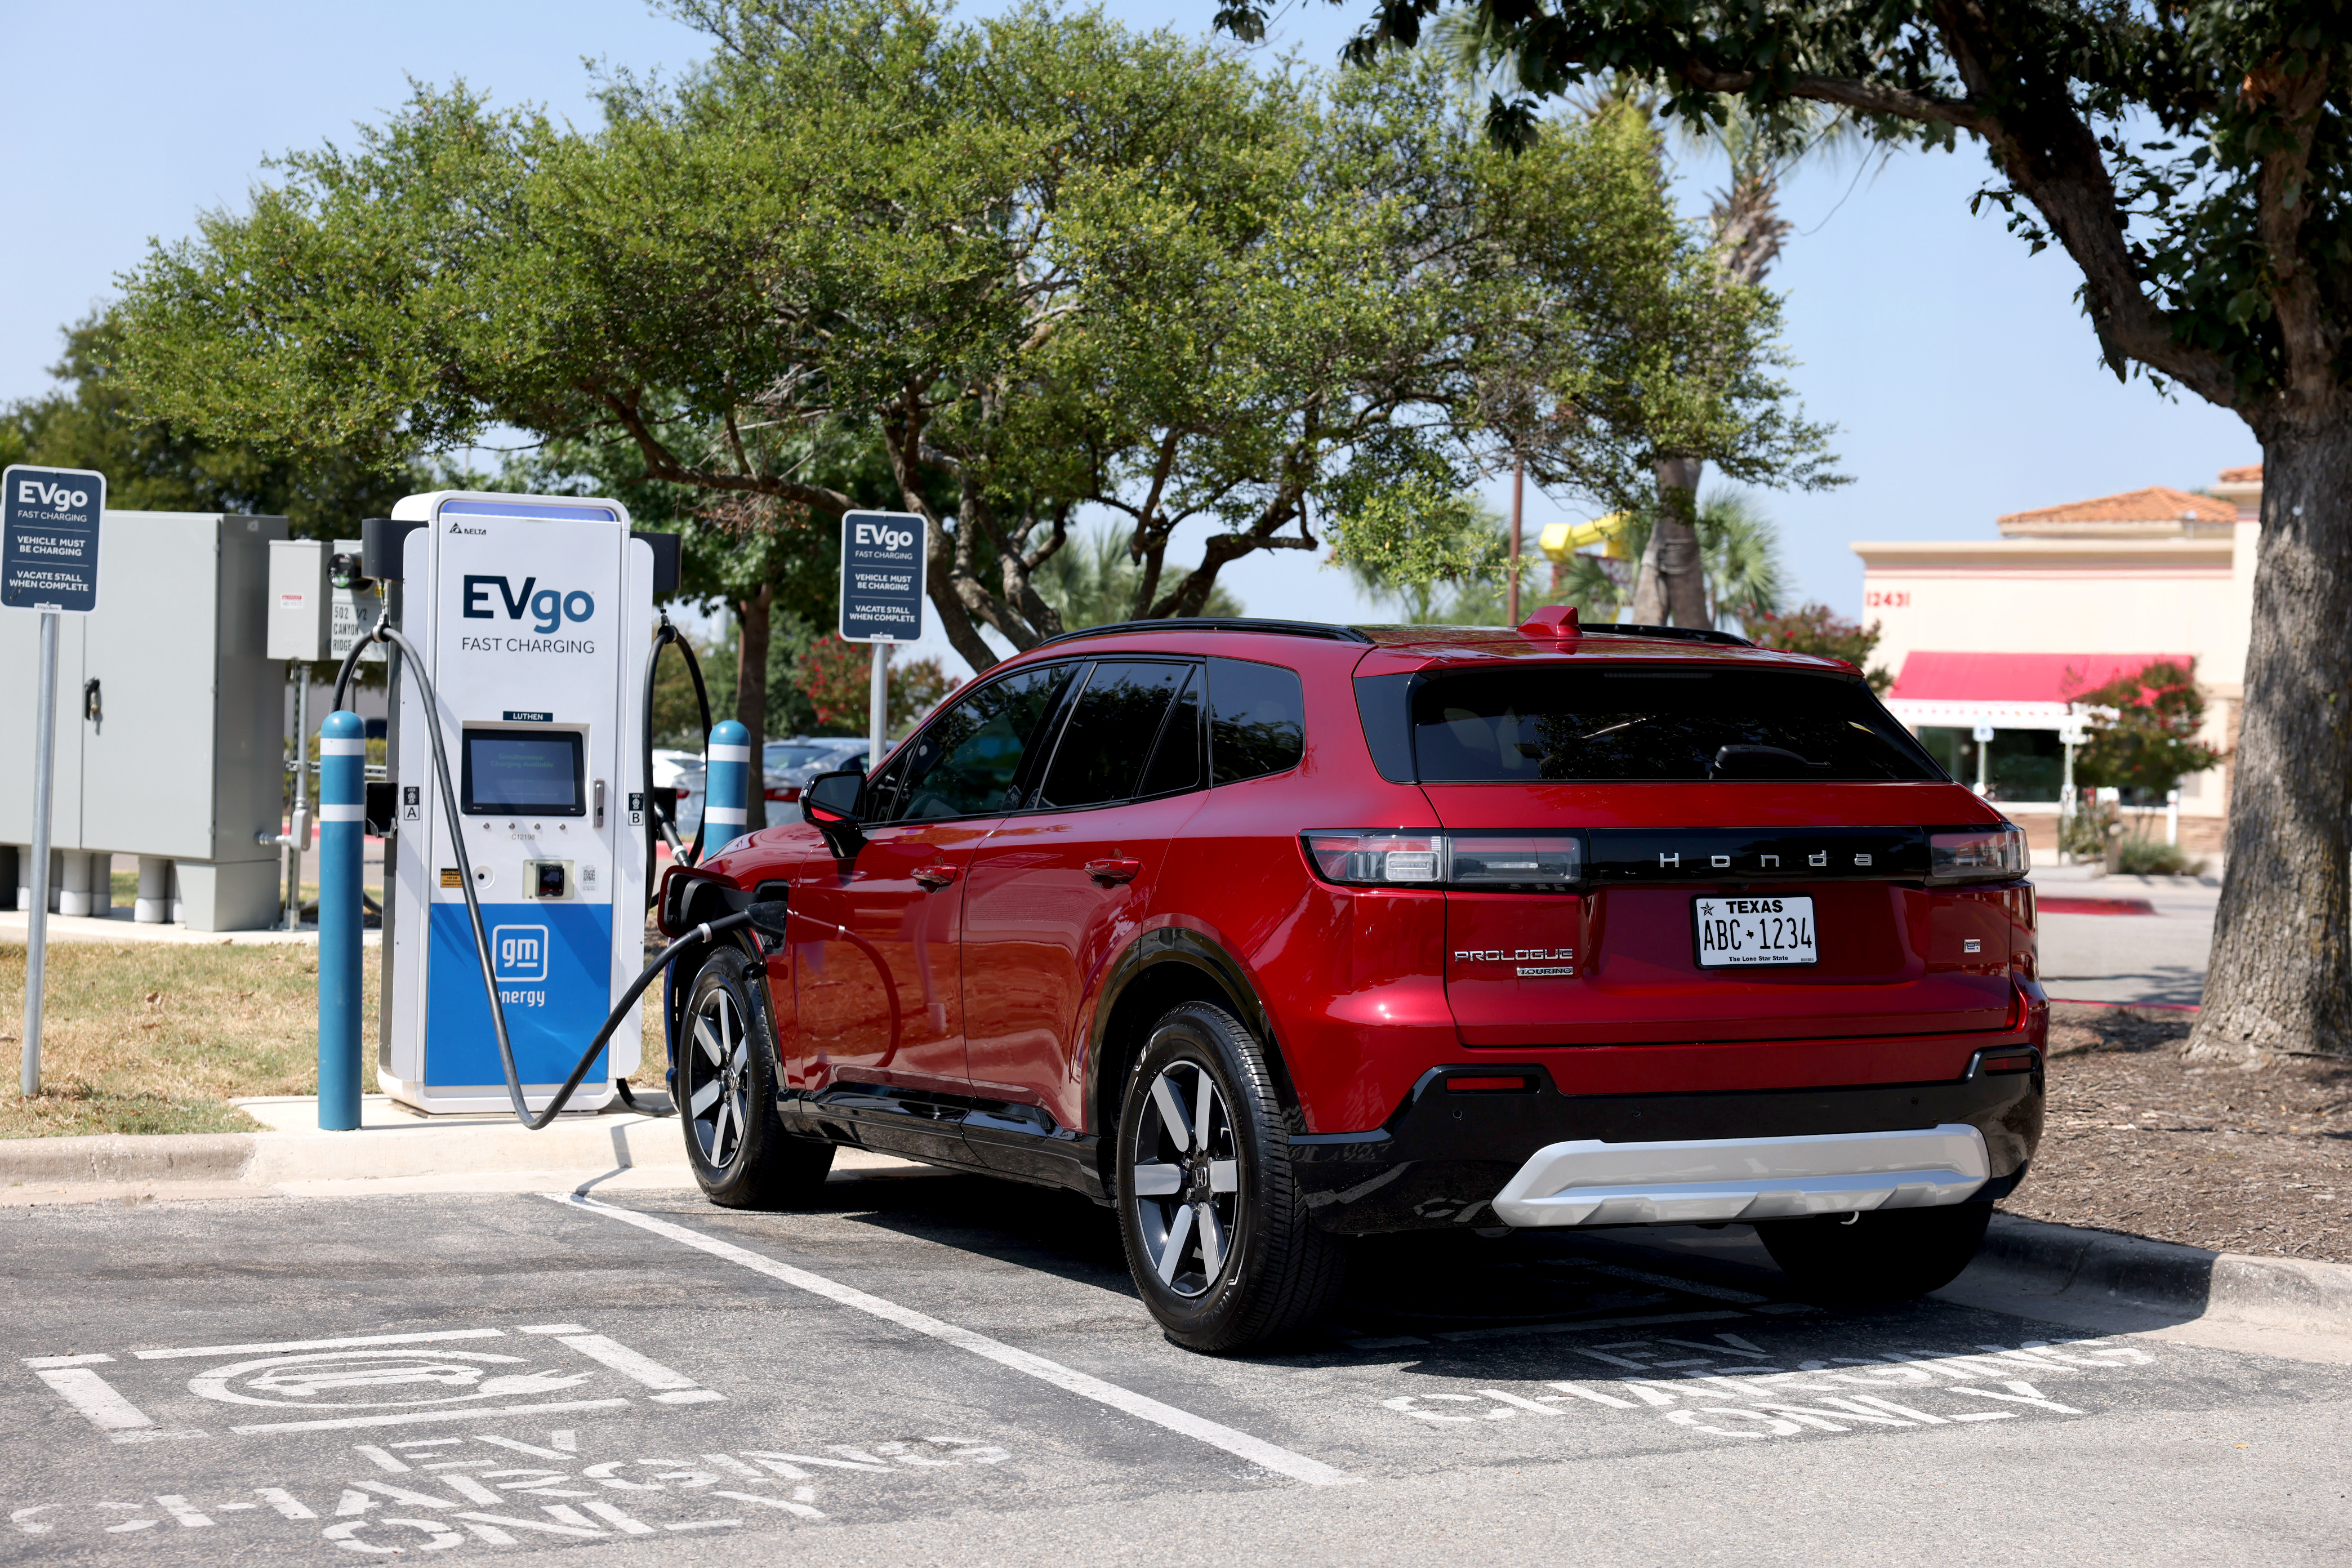
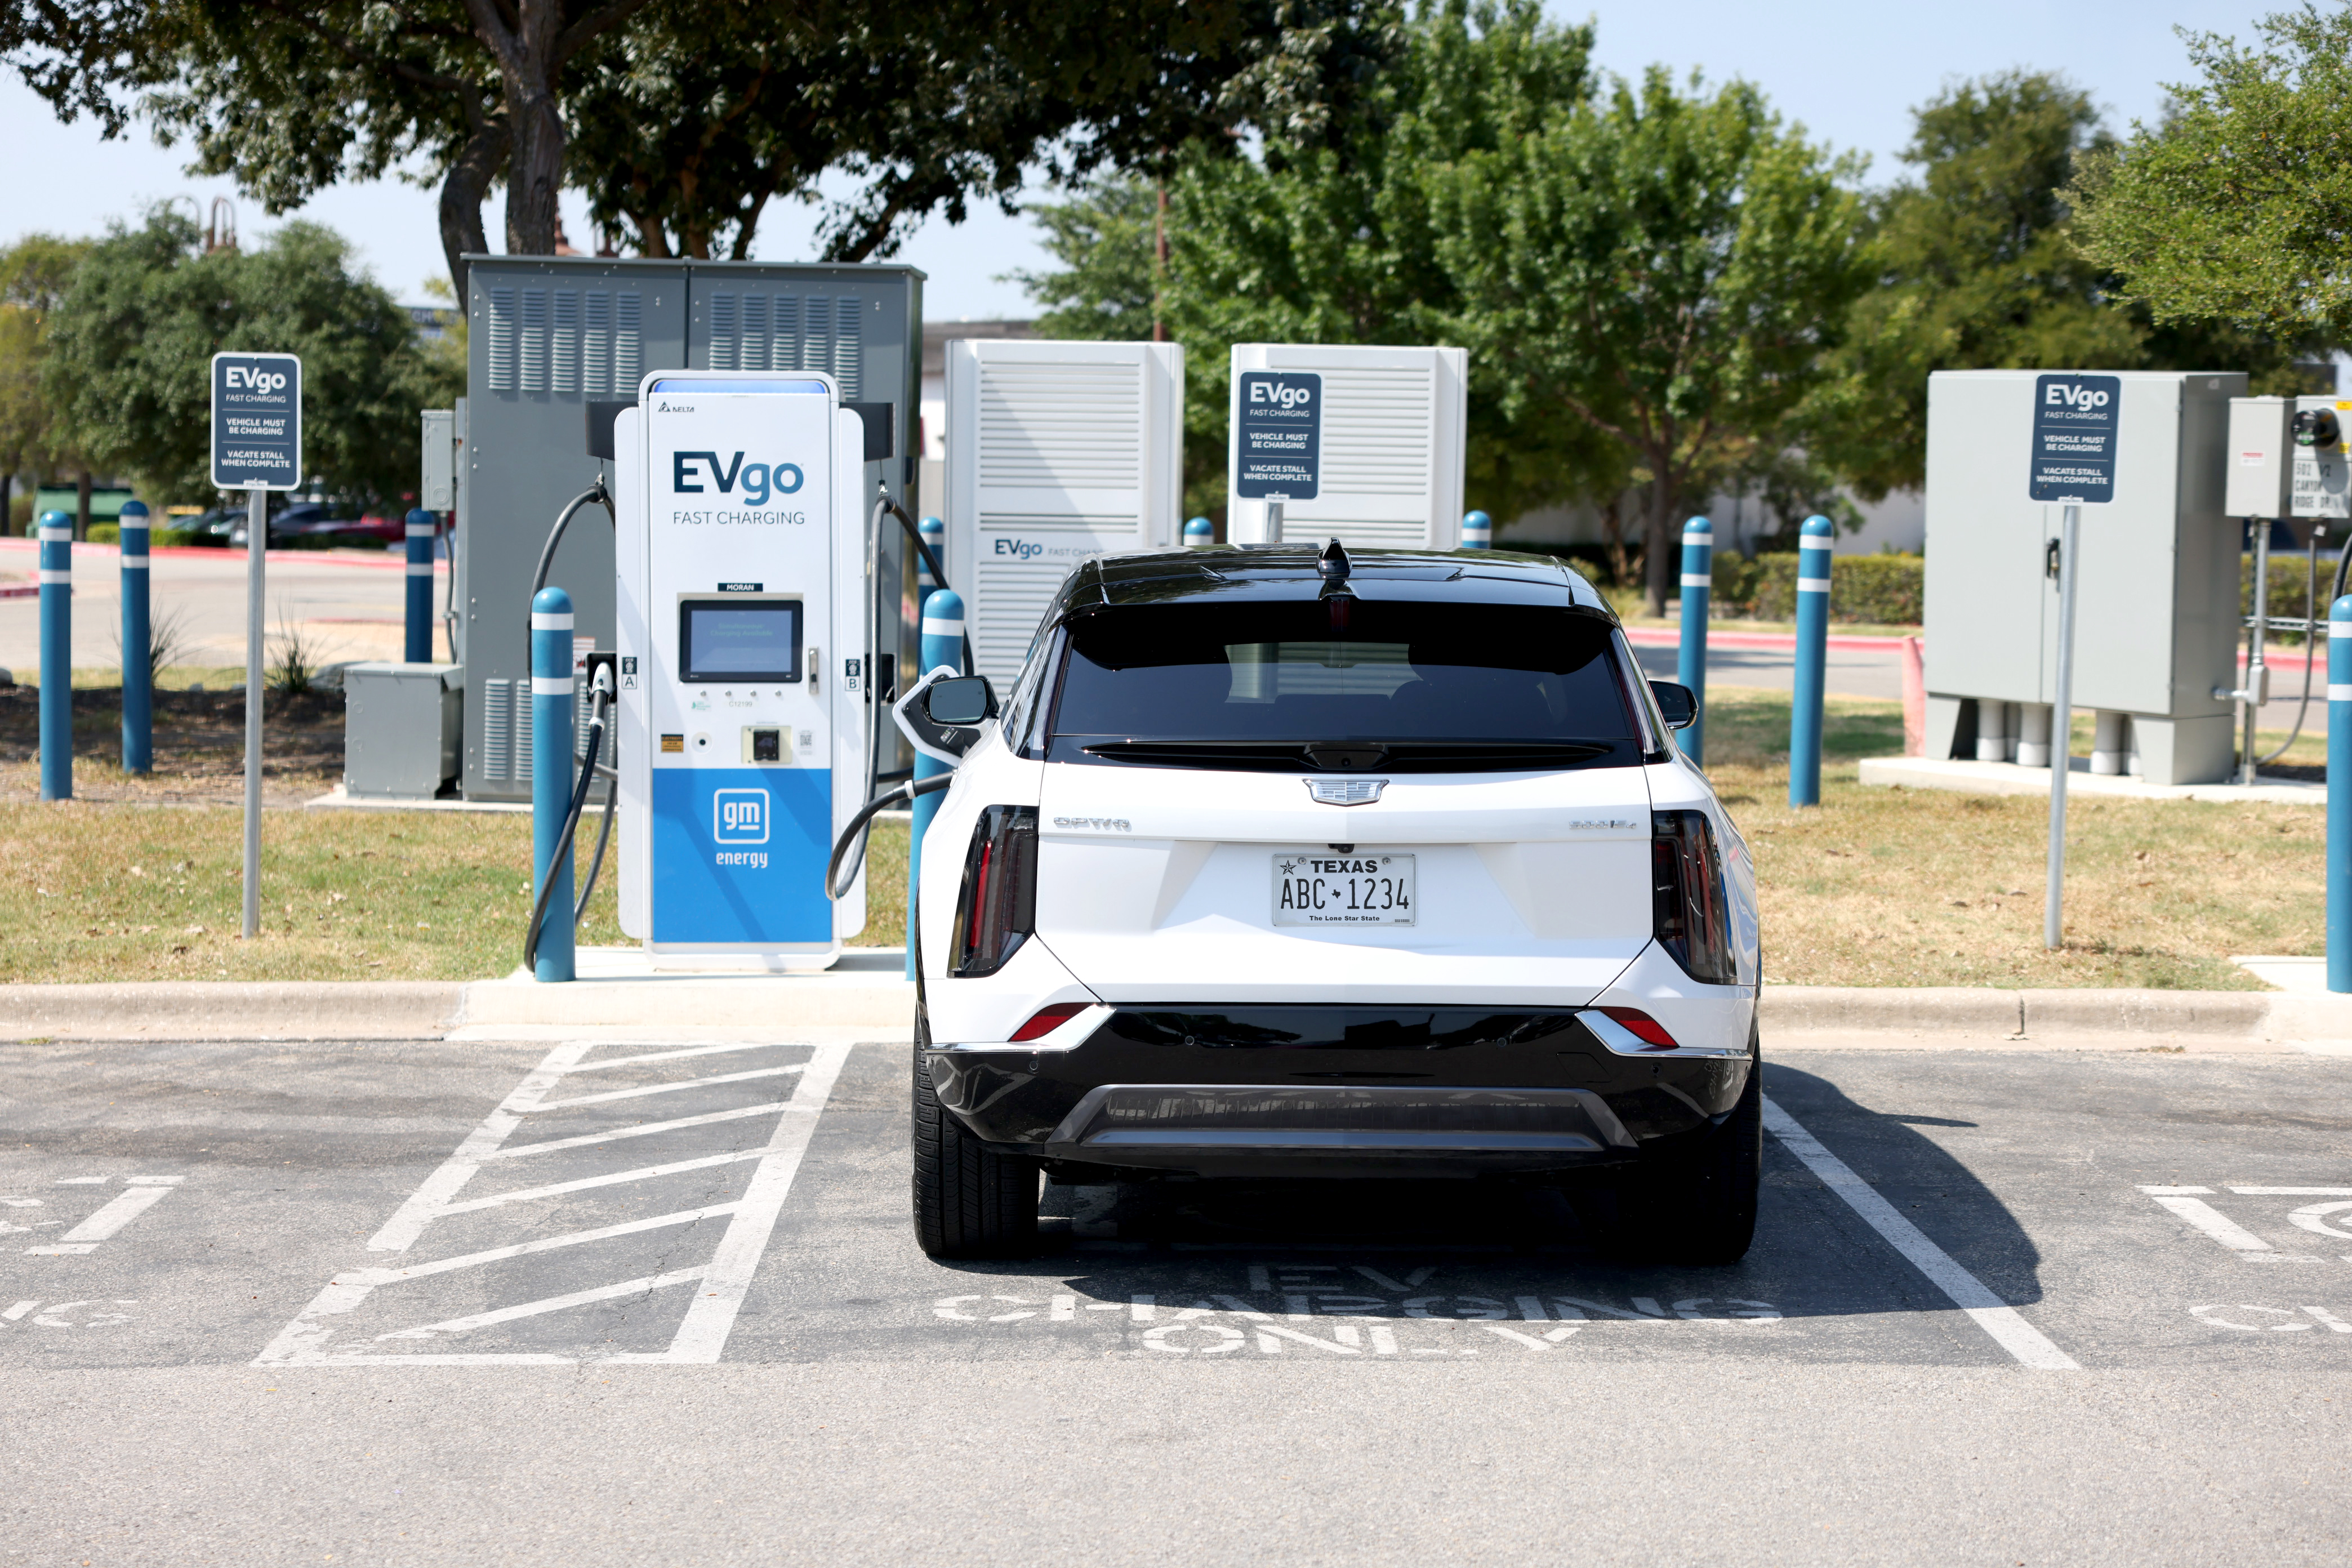
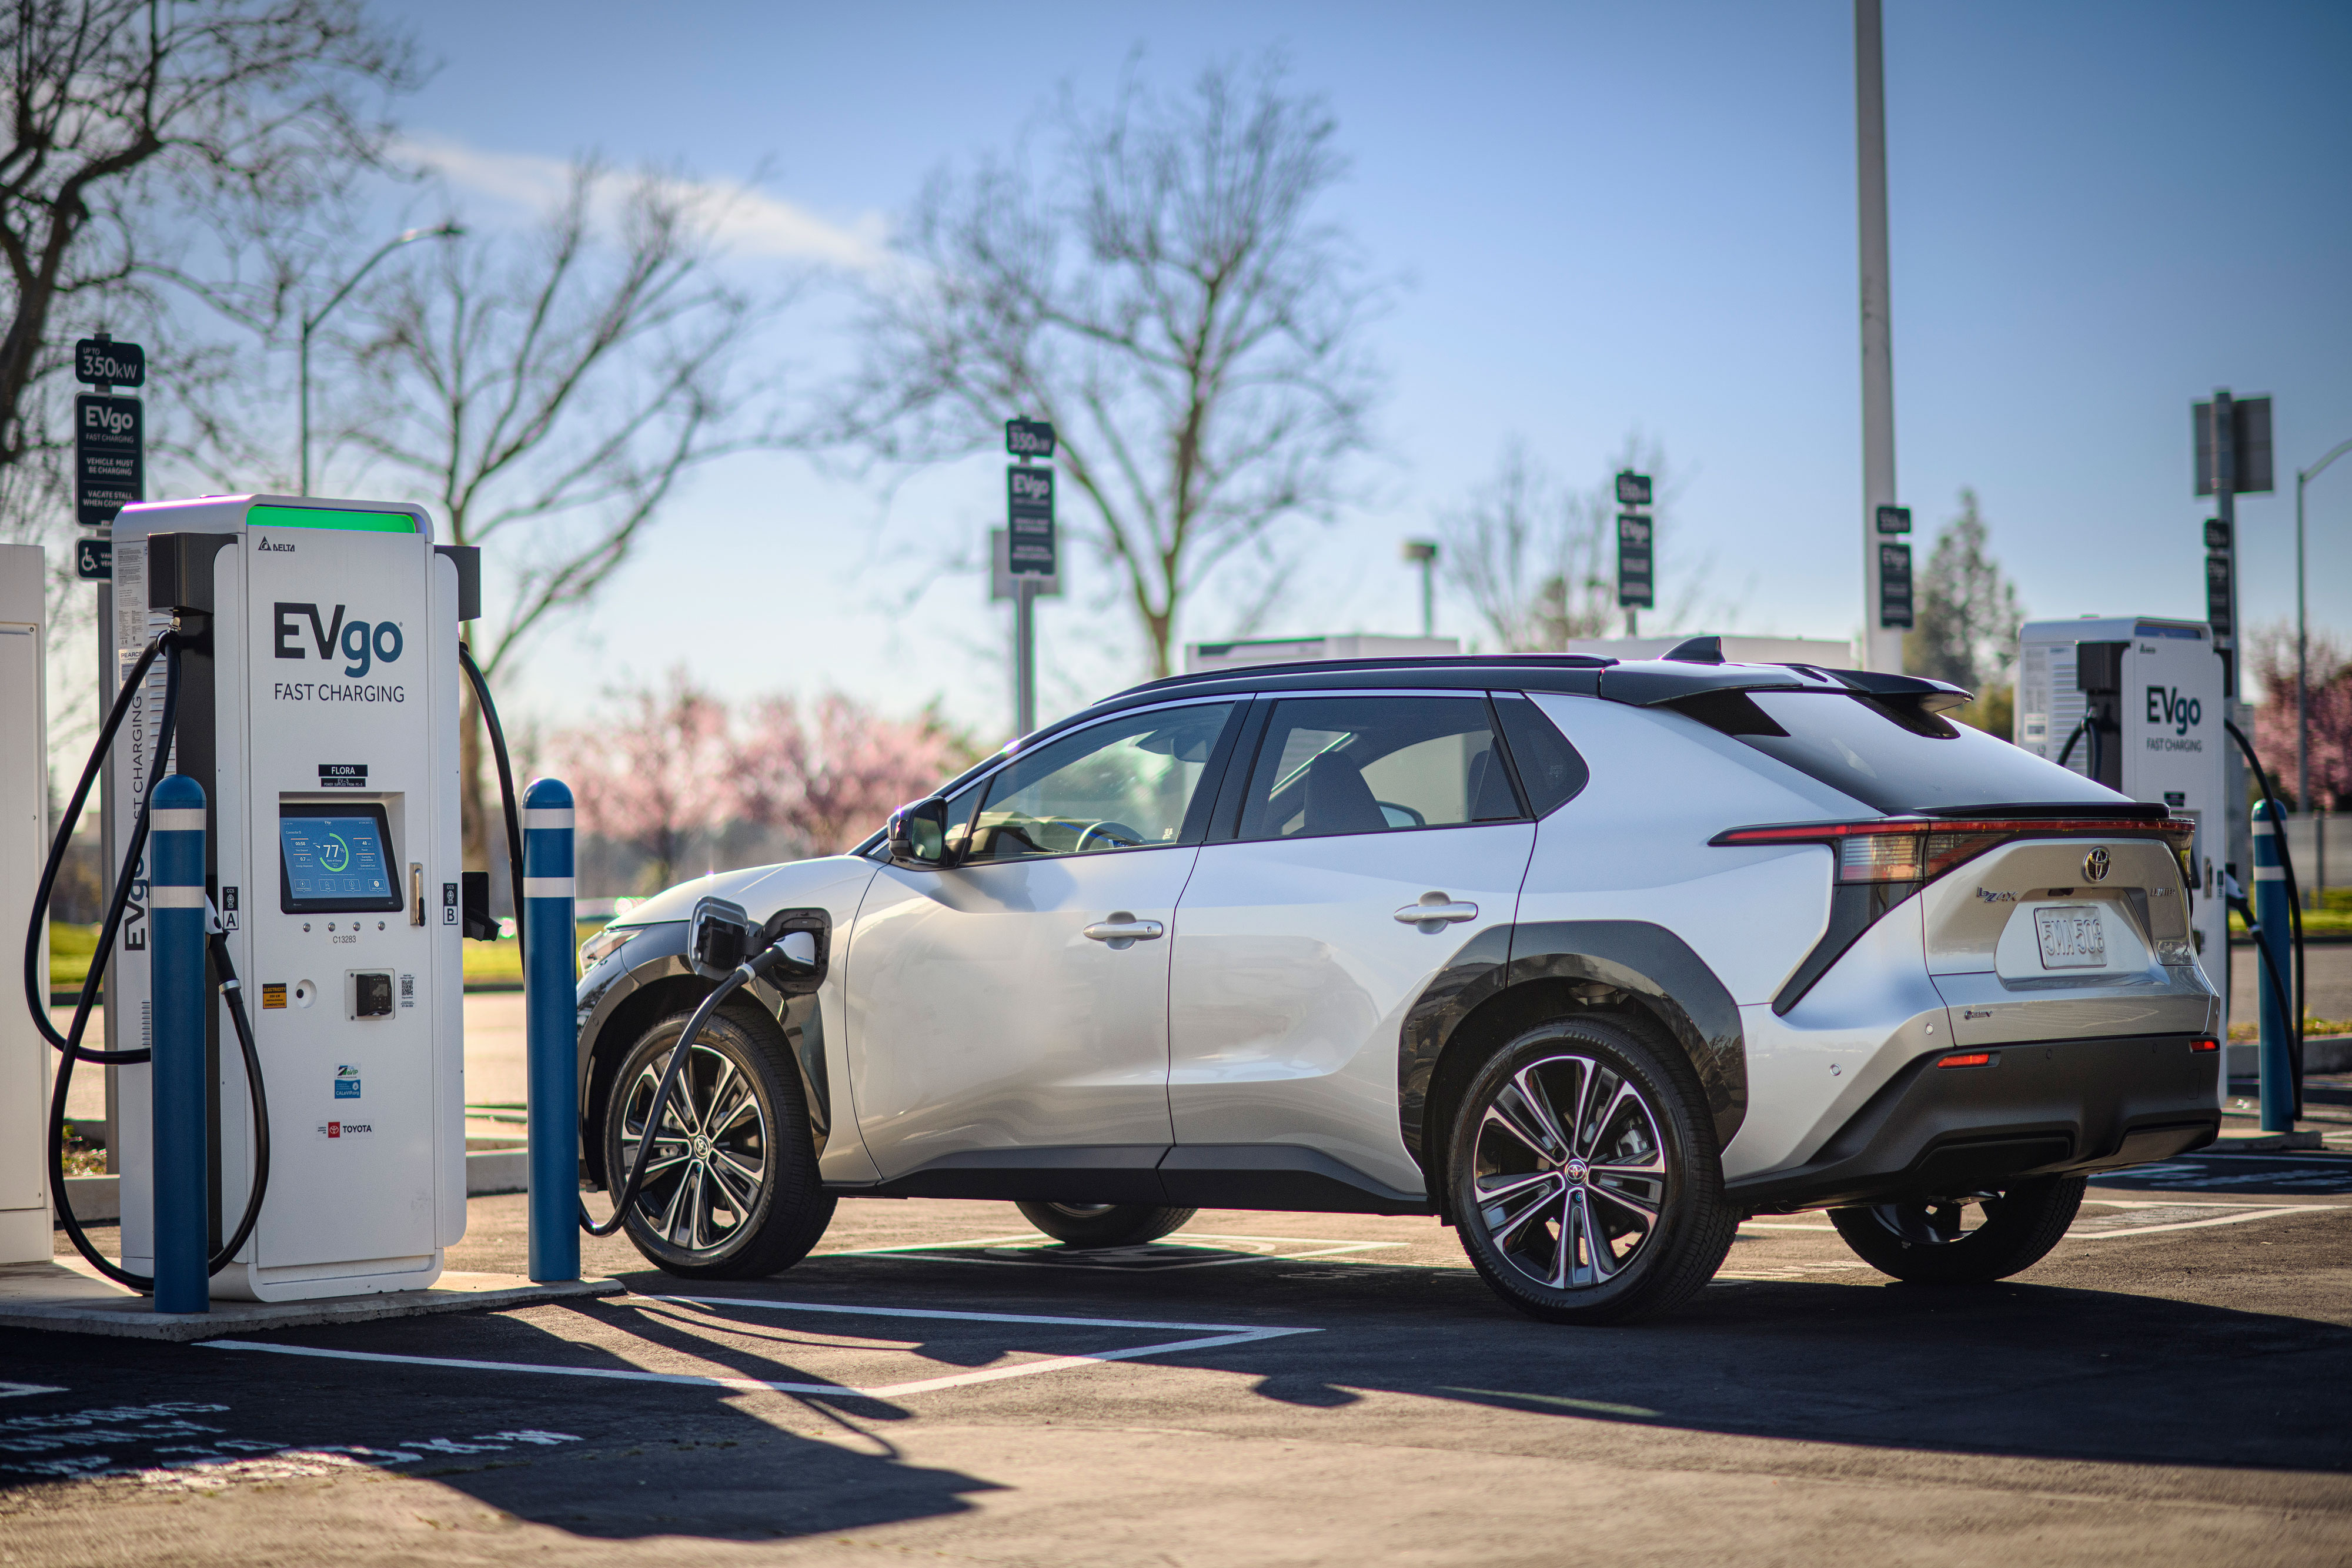
This report examines EVgo’s release and financial tables rather than presenting a hands-on charger test. The company-supplied photographs illustrate existing equipment, locations and charging activities. They do not show the announced 750-kW architecture, establish that a location opened during the reported quarter, or document the experience of a particular customer. The reported numbers also have different cutoffs: the financial quarter ends September 30, while the connector update runs through November 6.
The number on the charger is only the beginning
EVgo describes the new system as capable of delivering up to 750 kW and expects deployments to start in 2027. Those words matter. They establish a development direction and an anticipated starting window, not a nationwide installation date, a list of operational sites, or a promise that an existing vehicle can charge at that rate. The earnings release does not provide the complete configuration, operating envelope or rollout schedule needed to calculate a charging stop for a particular car.
Kilowatts measure power; kilowatt-hours measure energy. A charger’s power rating is not the size of a vehicle’s battery, and it is not the amount of energy a driver necessarily receives in an hour. The vehicle and charging system must support compatible operating conditions, and the car’s charging management determines how much power it accepts as conditions change. A large advertised maximum therefore cannot be inserted into a trip planner as a constant rate for an entire session.
The distinction is especially important when a driver compares a new architecture with the equipment already beside a familiar grocery store. A future high-power system may expand what the network can offer, but an existing stop still has its own connector, charger rating, access conditions and available stalls. EVgo’s announcement does not say the photographed stations are being converted immediately. Drivers should continue using the details for their actual stop rather than substituting the specifications of a future product.
The release also identifies a separate development: EVgo’s first v4 Supercharger location is live in the Chicago area. That is a current operating milestone, unlike the expected 2027 launch of the next-generation architecture. Calling both simply “new fast chargers” would erase a meaningful difference between equipment already available somewhere and a system still awaiting its first deployments. The release does not supply enough location-specific information to recommend a particular Chicago-area stall here.

Five thousand stalls does not mean five thousand public destinations
EVgo ended September with 5,530 stalls in operation, up from 4,590 a year earlier. A stall is not the same thing as a site or a city, and the total includes several operating arrangements. The company separately describes more than 1,200 fast-charging locations across 47 states. Neither figure means that every driver has convenient coverage or that every location offers the same equipment and amenities.
The largest component of the stall total was the EVgo public network: 4,020 stalls, compared with 3,570 a year earlier. EVgo defines these as stalls at publicly available stations that it owns and operates. Another 120 stalls belonged to its autonomous-vehicle network, down from 140. Those stations are available only to AV fleet customers. Including that fleet-only capacity in a count of chargers that any motorist can visit would overstate ordinary public access.
The remaining 1,390 stalls were associated with EVgo eXtend, compared with 880 a year earlier. The company describes these as stations built through partnerships for partners’ customers, with assets serviced through and often co-branded with its national network. That category grew considerably faster than the owned public network. It is therefore useful to ask not only how quickly the total is rising, but who owns a station, how customers reach it and how it appears in the relevant charging service.
EVgo added 160 new DC fast-charging stalls during the third quarter. The year-over-year difference of 940 stalls covers a different interval and should not be described as the quarter’s additions. A growing year-end target, an announced property partnership and an operating-stall count are likewise different stages of development. None should be exchanged for another simply because each sounds like evidence of expansion.

Why more retail parking lots matter
EVgo says expanded relationships with Brixmor and Regency Centers are intended to bring more than 900 new fast chargers to grocery-anchored shopping centers. This connects the financial story to a recognizable driver problem: the charging stop often competes with other errands. A well-placed station can make a necessary stop overlap with shopping instead of requiring a separate detour. The benefit depends on the actual location and driver’s routine, not just the retailer’s name.
A shopping-center installation also has a different purpose from a remote highway stop. Access roads, parking layout, walking distance to shops and the ease of returning to the vehicle shape whether it is convenient. A covered bank of chargers may offer a different experience from a small installation on the edge of a large lot. The supplied photographs show this range, but they are illustrations of site design, not comparative tests of availability or customer satisfaction.
The planned 900-plus chargers are not an additional 900 operating locations. EVgo’s release describes a partnership-led expansion and does not give a complete opening calendar for those installations. It would be premature to add that figure to the September operating total or to promise a new local station based on the footprint of the property owners. Permitting, utility work and construction remain relevant to turning a retail partnership into usable capacity; EVgo explicitly lists permitting and utility-related delays among its business risks.
For a driver, the practical milestone arrives when the planned station becomes an accessible listing with the correct connectors and operating information. For a retailer, the project must also fit an existing property and its circulation. For the operator, the installation needs enough use to justify investment. These are related interests, but an announcement alone does not demonstrate that all three have been satisfied at every proposed location.


The connector transition is visible, but not complete
As of November 6, EVgo reported more than 290 J3400, commonly called NACS, connectors in operation. That update is more recent than the September financial and stall totals. It signals a concrete expansion of connector choice, but it does not mean every EVgo station has NACS, every stall has been converted, or every vehicle can use every connector without checking compatibility.
The company says EVgo Superchargers and EVgo sites with NACS are available in Tesla navigation. Discoverability is a meaningful part of a charging network: a physically available station is less useful if it is absent from the planning tools a driver actually uses. Yet appearing in navigation is not a substitute for verifying the selected site, the vehicle’s requirements or the station’s current operating information before relying on it.
The connector update should also be kept separate from the 750-kW announcement. A plug format and a maximum power rating describe different parts of the charging system. The release does not establish that the more than 290 reported NACS connectors deliver 750 kW. Nor does it establish that all vehicles with that inlet can draw the same power. Combining those facts into a single promise would create a capability that the source does not claim.
The gallery’s existing connector and vehicle photographs help explain why the transition is a fleet-wide practical issue rather than merely a branding change. Drivers arrive with different vehicles and expectations. The release describes growth in EVgo’s infrastructure, but it does not publish a model-by-model compatibility table. Anyone choosing a stop still needs the current information for that vehicle and charger combination, including any manufacturer requirements for adapters.

Charging sales rose faster than energy delivered
The contrast between revenue and energy is one of the most revealing parts of the quarter. Charging-network revenue rose from $55.785 million to $71.788 million, an increase of 29%. Network throughput increased from 95 to 103 GWh, or 8%. Revenue growth therefore cannot be described simply as an equivalent increase in the volume of electricity delivered.
That does not establish that every customer paid a higher price, and the release’s headline figures are not a retail tariff sheet. Differences in charging programs, customers, contracts and revenue composition can affect the relationship between dollars and energy. Dividing the rounded totals and presenting the result as the price at a charger would conceal those differences. A driver’s actual price must come from the applicable station and plan, not an average reconstructed from a corporate results table.
EVgo reports another important measure: average daily throughput per stall on its public network was 283 kWh, compared with 295 kWh a year earlier. The reported average declined even though total network energy rose. That is possible when capacity and demand change at different rates or the mix changes. The two measurements answer different questions: one concerns energy across the network, the other concerns an average for a defined set of stalls.
EVgo adds that, excluding throughput from automaker charging programs, average daily throughput increased 7% year over year. That qualification makes the comparison more informative, but it should not replace the unadjusted figure without explanation. Both belong in the story. The company’s reported program-adjusted improvement and the decline in its overall public-network average can be true at the same time.
For drivers, neither statistic is a direct measure of the wait at a particular station. A network-wide average can combine sites with very different local demand, and an energy measure does not show when drivers arrive. It also does not establish charger uptime, failed-session rates or accessibility. Those would require different measurements. This earnings release is useful for understanding network scale and use, not for ranking an individual stop’s reliability.

The business beyond selling a charge
Total quarterly revenue slipped from $92.299 million to $91.417 million despite the rise in charging sales. The main offset was non-charging revenue, which fell from $36.514 million to $19.629 million. Within that group, eXtend revenue declined from $31.913 million to $16.200 million, while AV and ancillary revenue declined from $4.601 million to $3.429 million.
These figures show why a headline about charging demand does not describe the whole company. Infrastructure-related activity and charging services can generate revenue on different patterns. The results table alone does not establish that a lower quarter of eXtend revenue means the partnership network is shrinking: operating eXtend stalls increased over the year. Conversely, a larger stall count does not guarantee that revenue from building or supporting those assets will increase in every quarter.
Gross profit increased to $13.608 million from $12.560 million, and gross margin improved to 14.9% from 13.6%. The bottom line moved in the other direction: net loss widened to $49.207 million from $28.356 million. Readers should not treat improved gross margin as evidence of overall profitability. Costs beyond the direct cost of sales still affect the result.
EVgo also reported adjusted EBITDA of negative $3.530 million, compared with negative $4.975 million a year earlier. That measure improved, but it is a non-GAAP measure and is not interchangeable with the net loss. The release provides definitions and reconciliations. For readers assessing the charging operator’s development, the useful approach is to show the adjusted measure alongside the standard financial result rather than letting one erase the other.

Expansion still requires capital
EVgo’s quarterly capital expenditures under GAAP were $34.840 million, compared with $26.152 million a year earlier. The company identifies several capital offsets, including automaker infrastructure payments, capital-build funding and proceeds from transferring tax credits. After those offsets, its separately defined net capital-expenditure measure was $24.233 million, compared with $4.161 million. That comparison reflects changes in the offsets as well as spending.
The company sold its 2025 portfolio of Section 30C income-tax credits for $7.7 million net of transaction costs. That is a company financing event described in the results, not an offer of a credit to a driver buying an EV. The source’s discussion of policy risks likewise should not be turned into individual tax advice. What it demonstrates here is that the cost of building infrastructure and the sources used to support it are part of the charging expansion story.
Cash used in operating activities for the quarter was $15.232 million, lower than the prior-year quarter’s $22.828 million. For the first nine months, however, operating cash use was $57.084 million, compared with $18.985 million. Looking at only the quarter could hide the different year-to-date comparison. A network being built over multiple years needs more than one favorable quarterly metric to establish its long-term financial trajectory.
EVgo’s updated 2026 guidance calls for 1,075 to 1,275 total new stalls, $375 million to $400 million in total revenue and adjusted EBITDA between negative $30 million and negative $15 million. These are management expectations, not reported year-end outcomes. The release identifies financing, competition, policy changes, supply chains and utility connections among the risks that can affect future results. It does not promise that every planned deployment arrives on a fixed schedule.

A separate ownership question
The results arrive while EVgo is considering a proposal from LS Power Equity Advisors. The company says its board received an unsolicited, non-binding proposal on November 2 to acquire Class A shares not already owned by LS Power for $2 per share in cash. A committee of independent and disinterested directors has been established to evaluate it and may retain independent advisers.
As of the November 9 release, EVgo says no decision had been made on its response. There was no assurance of a definitive agreement, approval or completed transaction. The proposal must therefore be described as a proposal, not an acquisition already completed. It also does not, by itself, establish a change to a driver’s charging account, current prices or the availability of a station.
The operational and ownership stories can coexist without being collapsed into a prediction. The release describes operating chargers, expansion plans and an unresolved corporate proposal. A driver deciding where to stop needs current charging information. A reader following the business needs subsequent official disclosures before drawing conclusions about ownership. Neither should be asked to rely on an outcome that the company itself says remains uncertain.

What to watch next
The next useful evidence will be more specific than another peak-power headline. For the 750-kW architecture, it will include the first confirmed deployments and their actual capabilities. For the retail partnerships, it will include named sites becoming operational. For the connector transition, it will include which existing and new locations offer the needed equipment. Those milestones would connect the company’s strategy to stops that drivers can actually use.
The next results will also help separate expansion from utilization. Operating-stall counts, energy delivered, revenue composition and the clearly defined public-network throughput measures can show whether additional capacity is being used as intended. No single one supplies the complete answer. Reporting them with their correct periods and definitions is more informative than choosing whichever percentage looks strongest.
EVgo’s November 9 announcement is consequential because it combines near-term hardware progress, a retail-location strategy and a longer-term power upgrade while exposing the financial work still required. Its charging business is growing, but total sales and losses show a less linear picture. For American EV drivers, the development to value is not simply the largest number on a future charger: it is the arrival of compatible, accessible capacity where a charging stop fits the journey.



Comments
Post a Comment